Fig. 6.
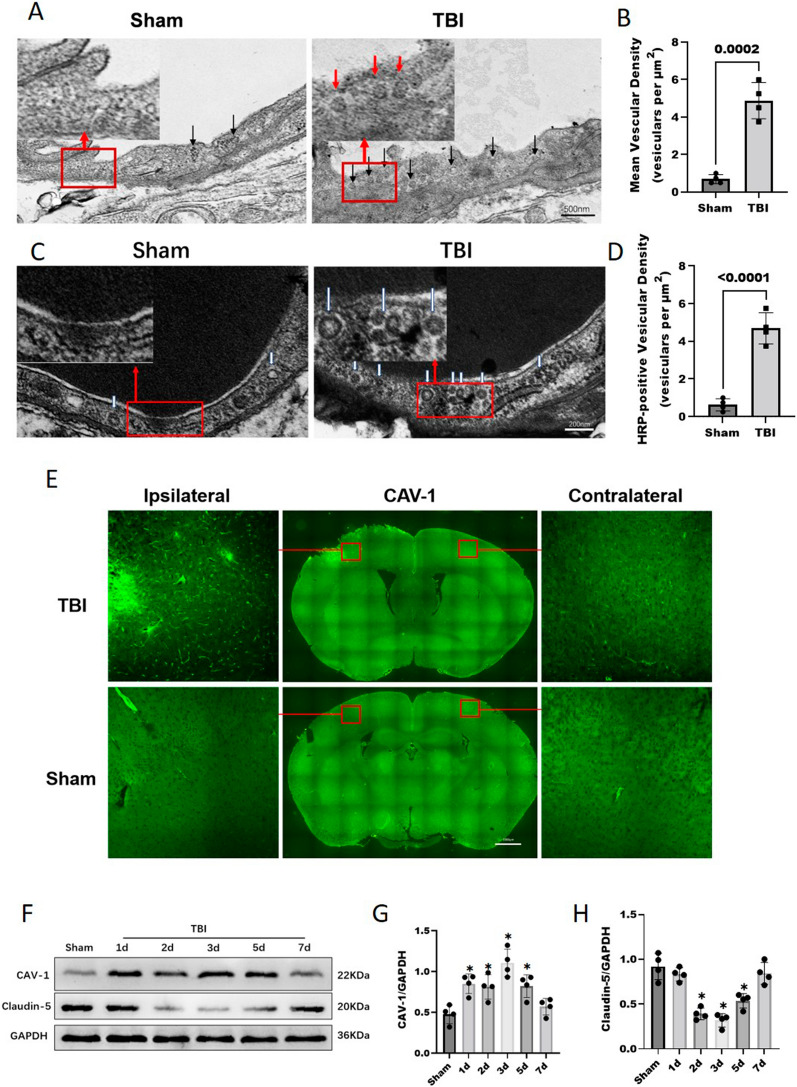
Cerebrovascular ECs contain high levels of transcytotic vesicles after TBI. A TEM images show more transcytosis vesicles (black arrows) in ECs (ECs) after TBI compared with their controls. Scale bar = 500 nm. B Quantification of the transcytosis vesicles densities in mice of the TBI and Sham groups. Data was analyzed by two-tailed student t-test, n = 4/group. C, D HRP was injected into the tail veins of mice after TBI and into those of the corresponding controls, followed by TEM. An electron-dense DAB reaction (black) was observed in the blood vessel lumens of HRP-injected mice. HRP-filled vesicles (white arrowheads) (C) were observed in ECs and quantified (D). Data was analyzed by two-tailed student t-test, n = 4/group. Scale bar = 200 nm. E Representative immunofluorescence images of CAV-1 protein expression on day 3 after TBI. Each red square represents the respective magnified inset. The expression of CAV-1 was significantly increased after TBI. Bar = 1000 μm. F, G, H Representative WB analysis and quantification of the relative densities of the CAV-1 (G) and claudin-5 (H) bands. Data was analyzed by one-way ANOVA and Tukey’s multiple comparisons test, *P < 0.05 compared with the Sham group, n = 4/group. All values are presented as the mean ± SD

