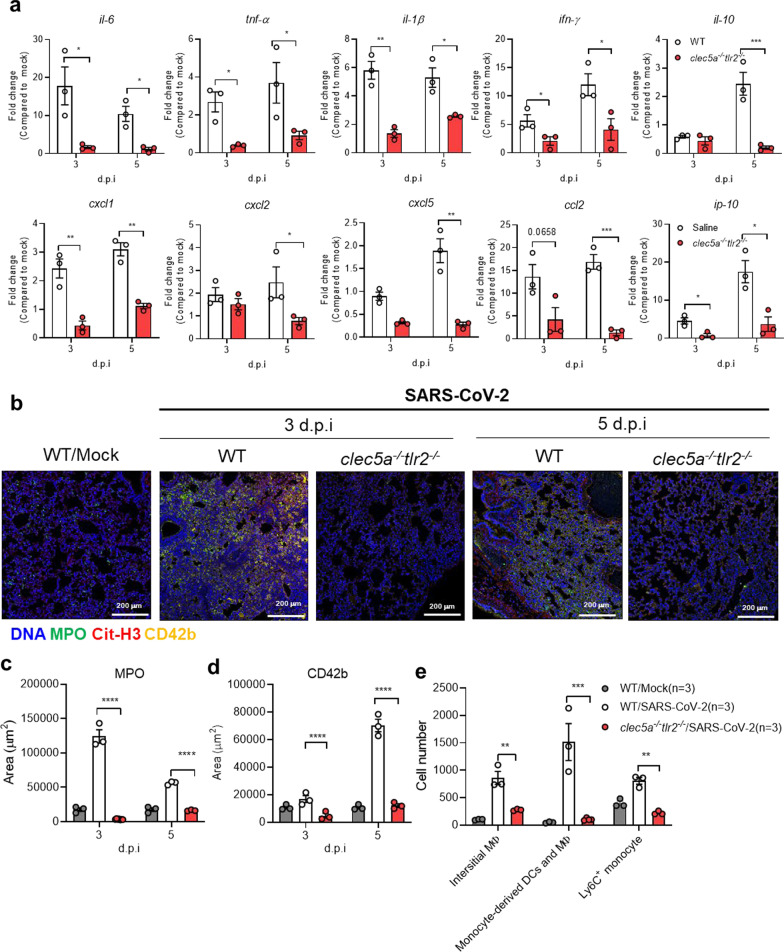
Fig. 3.
Attenuation of SARS-CoV-2-induced thromboinflammation in CLEC5A and TLR2 deficient mice. C57BL/6 mice (WT) and clec5a−/−tlr2−/− mice were inoculated with AAV-hACE2 for 14 days, followed by intranasal inoculation of SARS-CoV-2 (8 × 10⁴ PFU/per mice). Tissues were collected at 3 days and 5 days post-infection. N = 3 of each group a The level of proinflammatory cytokines and chemokines were measured by real-time PCR and presented as fold change (compared to AAV-hACE2 uninfected mice/mock). b–d NET structure and thrombus were detected by Hoechst. 33342 (blue), anti-MPO antibody (green), anti-citrullinated histone H3 (red), anti-CD42b antibody (yellow) (b), and images were captured by a confocal microscope and subjected to determine the area of MPO (c) and CD42b (d) using MetaMorph™ software. e Cell infiltrated to lung at 3 d.p.i.. Interstitial macrophage (interstitial MФ) was defined as CD11b+CD64+F4/80+ cells; monocyte-derived dendritic cell (DC)/macrophage (MФ) was defined as CD11b+CD64+Ly6C+; Ly6C+ monocyte was defined as Ly6C+. The cell number of each cell population was calculated using the multiple fluorescent staining image and analyzed by software MetaMorph™, and the data was presented as cell number/ per 664225 (815 × 815). Scale bar is 200 μm. Data are represented as mean ± SEM. *p < 0.05, **p < 0.01, ***p < 0.001, **** p < 0.0001 (Student’s t-test)

