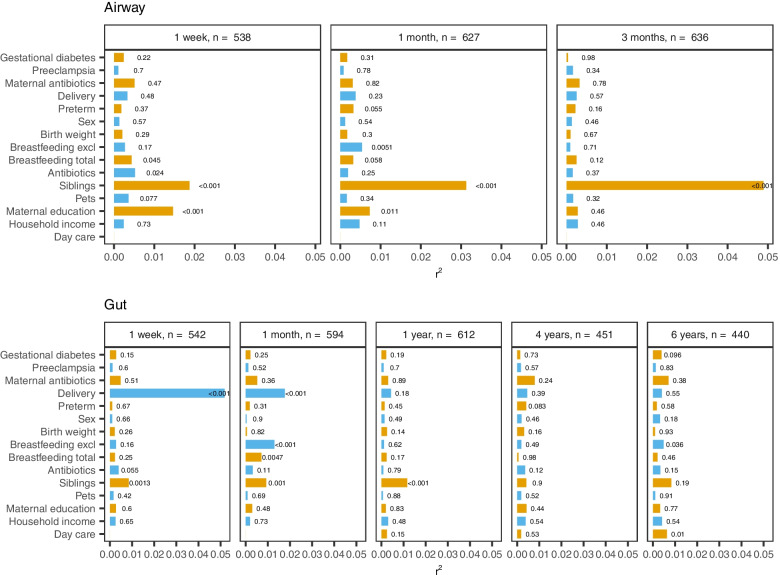
Fig. 3.
Microbial variance of weighted UniFrac distances explained by 15 different covariates, including siblings, stratified by sample site and time. Horizontal bars and corresponding labels show the variance (r2) explained by each covariate as well as the p-value, determined by PERMANOVA (9999 permutations). All factors are mutually adjusted apart from the two breastfeeding variables, which are not adjusted for each other. Breastfeeding is defined as yes/no at sampling for the 1-week, 1-month, and 3-month time points and for total breastfeeding additionally the 1-year time point, while the time points thereafter reflect the breastfeeding duration. Distribution of covariates across time is shown in Supplemental Table 1. Test for variance homogeneity and post hoc robustness test are shown in Supplemental Tables 4 and 5

