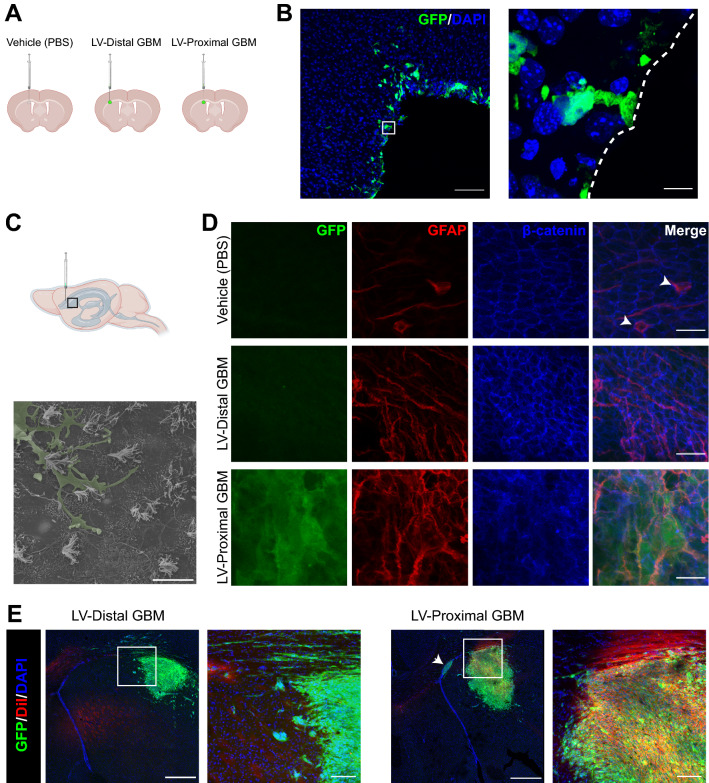
Fig. 1.
Ependymal cell lining of the lateral ventricle is disrupted by lateral ventricle-proximal glioblastoma. A Schematic of groups and injection sites. Created in Biorender.com B Representative coronal IHC image of multiple GFP + GBM cells in the parenchyma contacting the lateral ventricle in the LV-proximal group (n = 5). Scale bar = 100 µm. Zoomed in image shows a GFP + GBM cell extending a singular process to interact with the LV lumen. The lateral ventricle is designated with a a dashed white line. Scale bar = 10 µm. C Lateral ventricle cartoon displaying where images were taken for 1C-D. Scanning electron microscopy image of an invading cell on the ependymal cell apical surface (n = 3). Invading cell pseudocolored in green. Scale bar = 10 µm. D Representative lateral ventricle wholemount images in LV-proximal vehicle (top), LV-distal GBM (middle), and LV-proximal GBM (bottom) groups (n = 3). Pinwheel formations with GFAP + centers are indicated with white arrowheads. Scale bar = 20 µm. E Representative coronal immunohistochemistry images in LV-distal GBM (left) and LV-proximal GBM (right; n = 5 per group) showing increased DiI entry into LV-proximal GBM tumors and invading cells in zoomed out photo (arrow). Scale bar = 500 µm for zoomed out photos, 100 µm for zoomed in photos

