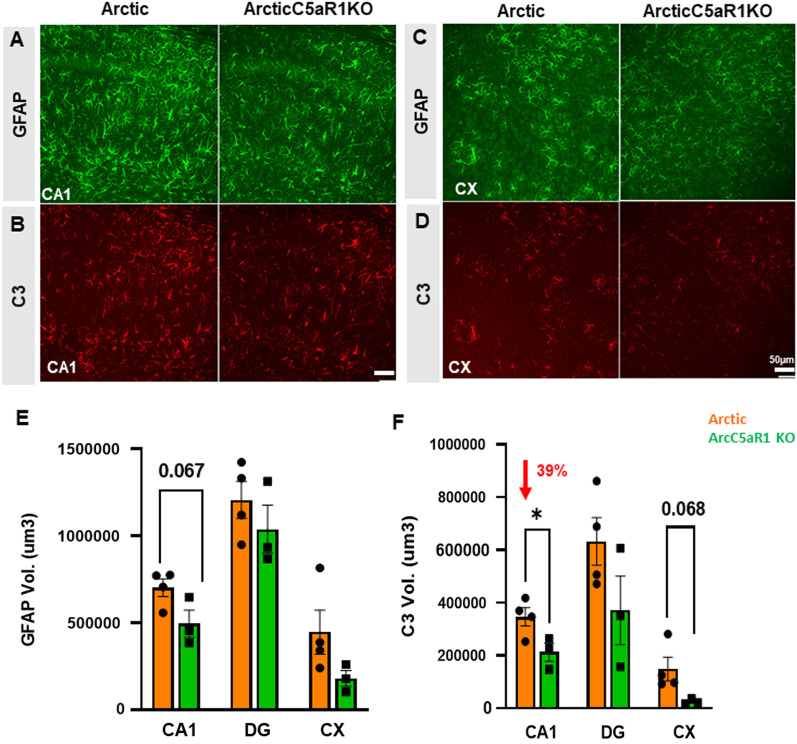
Fig. 7.
Lower astrocyte C3 expression in ArcticC5aR1KO compared to Arctic mice. Representative confocal images of GFAP immunostaining in the hippocampal cornu ammonis 1 (CA1) region (A) and in cortex (CX) (C) region and C3 immunostaining in the CA1 region (B) and in CX region (D) of Arc and ArcC5aR1KO brain at 7 months of age. Quantification of GFAP (E) and C3 (F) volume in the CA1, DG and CX. Z stack (31 steps, 30 um) one area/region (confocal Leica SP8, 20×). Data shown as mean ± SEM. *p < 0.05. T-test. N = 3–4 mice/genotype. Scale bar 50 µm

