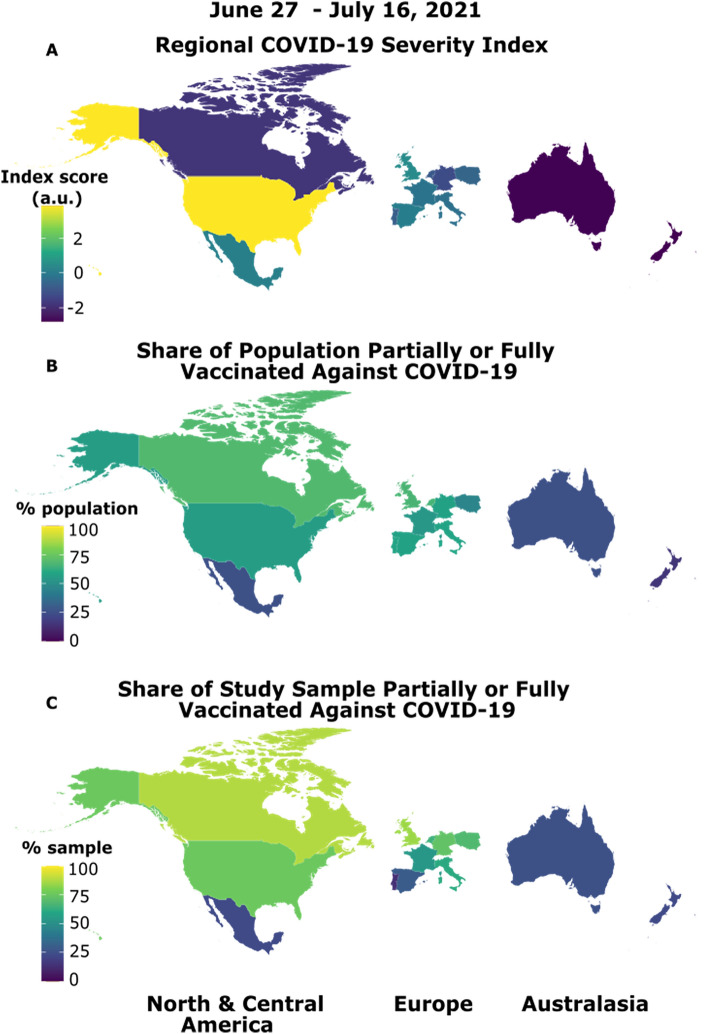
Figure 1.
Pandemic and vaccine situations varied across our multinational sample at the time of testing. The R package "maps" was used to visualize regional differences on the COVID-19 Regional Severity Index and population and study sample vaccine situations (https://cran.r-project.org/web/packages/maps/index.html). (A) The Regional COVID-19 Severity Index is a nation’s component score (in arbitrary units, a.u.) from a principal component analysis of weekly COVID-19 cases/death rates, total cases/deaths since the first week of 2020, and population-adjusted total cases/deaths per 100,000. These nation-specific data were extracted from the European Centre for Disease Prevention and Control COVID-19 statistics30 for each participant based on the week they completed the study. (B) The share of each nation’s population who were partially or fully vaccinated (i.e., one or more doses) against COVID-19, shown as the average percentage across our testing window; data were extracted from31. These data show lower proportions (15%) in countries only beginning vaccine roll-out (e.g., New Zealand) to almost 70% of the population in countries with earlier access to vaccines (e.g., United Kingdom, United States) and/or rapid uptake (e.g., Canada). (C) The share of participants from each country who were partially or fully vaccinated against COVID-19 (range 13% to 88%). Our sample was generally representative of population rates; the difference between sample rates (C) and population rates (B) for each country are plotted in Fig. S1.

