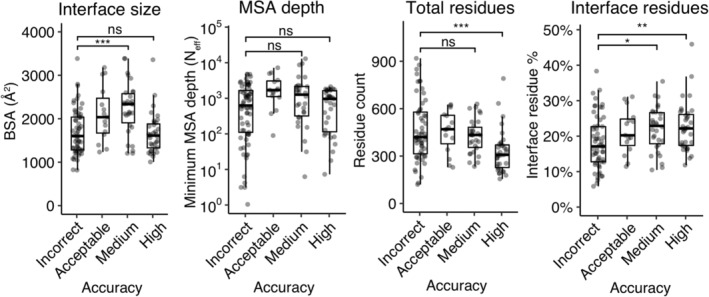
FIGURE 3.

Assessing test case features associated with AlphaFold success. Protein complex and MSA feature values were computed for all cases, which are shown according to AlphaFold success (best AlphaFold model accuracy in the five models for that case). Features shown are interface buried surface area (BSA), MSA depth (N eff) for the ligand or receptor (minimum value of the two), total number of residues, and percent of total residues in the protein–protein interface. Statistical significance values (Wilcoxon rank‐sum test) were calculated between feature values for sets of cases with incorrect versus medium and incorrect versus high‐ CAPRI accuracy, as noted at top (ns: p > .05, *p ≤ .05, **p ≤ .01, ***p ≤ .001)
