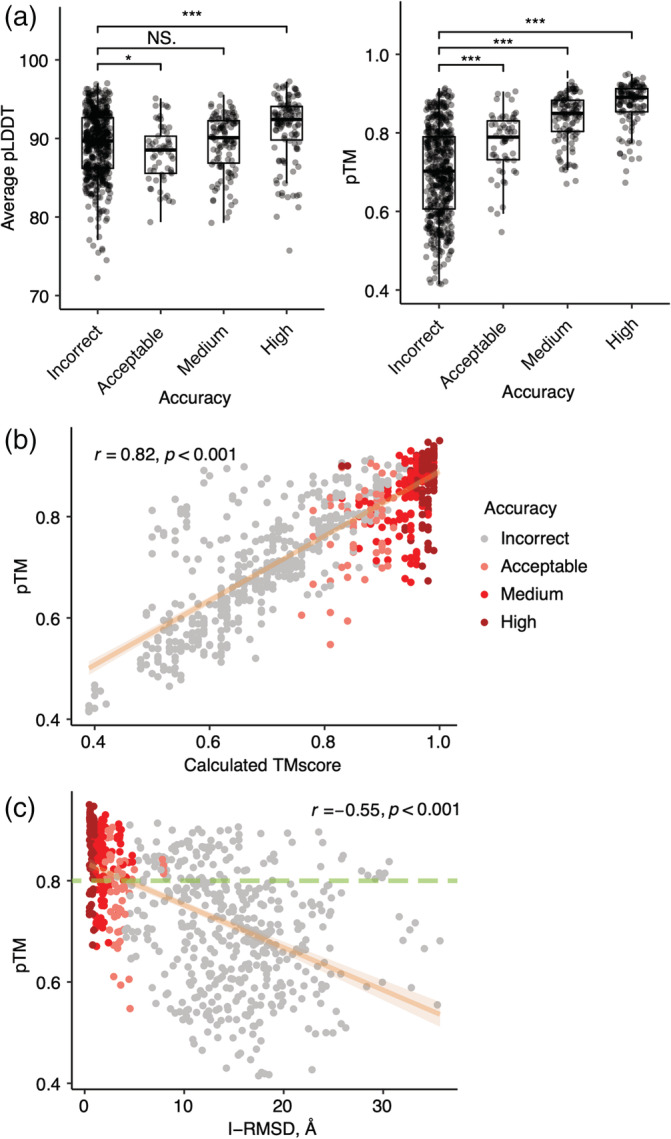
FIGURE 5.

Association between AlphaFold predicted scores and docking model quality. (a) Average pLDDT and pTM per CAPRI criteria. Statistical significance (Wilcoxon rank‐sum test) between average pLDDT or pTM of incorrect versus acceptable, incorrect versus medium and incorrect versus high CAPRI criteria is indicated at the top (ns: p > .05, *p ≤ .05, **p ≤ .01, ***p ≤ .001). (b) Comparisons between pTM and calculated TM‐score and (c) between pTM and I‐RMSD are shown as scatter plots. All 5 models for 149 cases are shown as points, colored by model quality by CAPRI criteria. Linear regression is shown along with the 95% confidence interval (orange area), and Pearson's correlation coefficients and correlation p‐values are denoted in (b) and (c). In (c), the dashed green line indicates a possible pTM score cutoff (pTM = 0.8) for selection of accurate docking models, based on optimization of sensitivity and specificity for incorrect versus medium and high model discrimination
