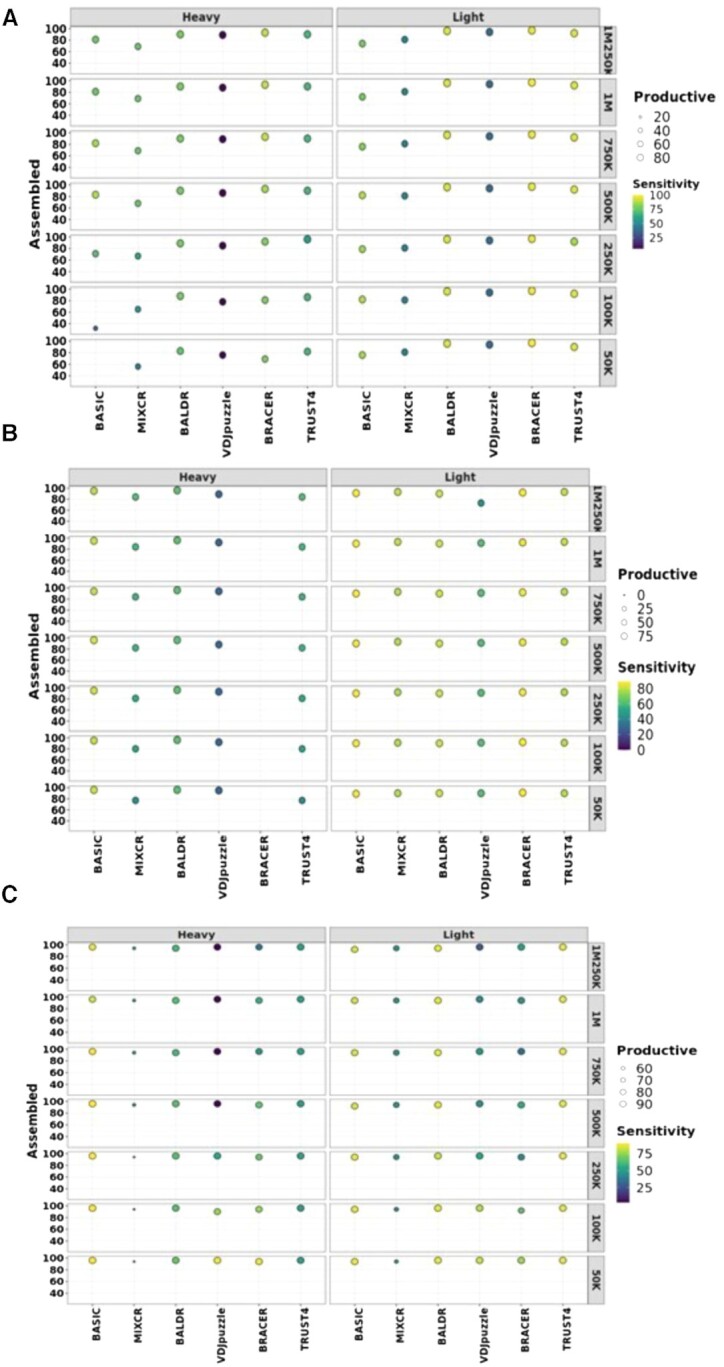
Figure 2.

Performance of each method on different datasets. Effect of sequencing depth on the assembly, productivity and sensitivity of each tool in (A) the Leiden dataset created in this work, (B) the Canzar dataset and (C) the Upadhyay dataset, consisting of 72, 51 and 113 paired-end single-cell libraries. Original libraries were generated using either SPEC-seq or SMART-seq2 technology and had 100-, 50- and 100-bp-long reads, respectively. These datasets were downsampled to different coverages as displayed in the figures to test the effect of coverage on the assembly, productivity and sensitivity of BCR heavy and light chains (LcK or LcL). Assembled are heavy and light chains without stop codons. Productive are assembled heavy and light chains with in-frame V–J junctions. Left y-axis depicts % of assembled chains over the total number of single cells in each dataset. Right y-axis corresponds to coverage. The size of the circles is proportional to the % of the productive chains. Higher intensity of the yellow color of the circles corresponds to the higher sensitivity.
