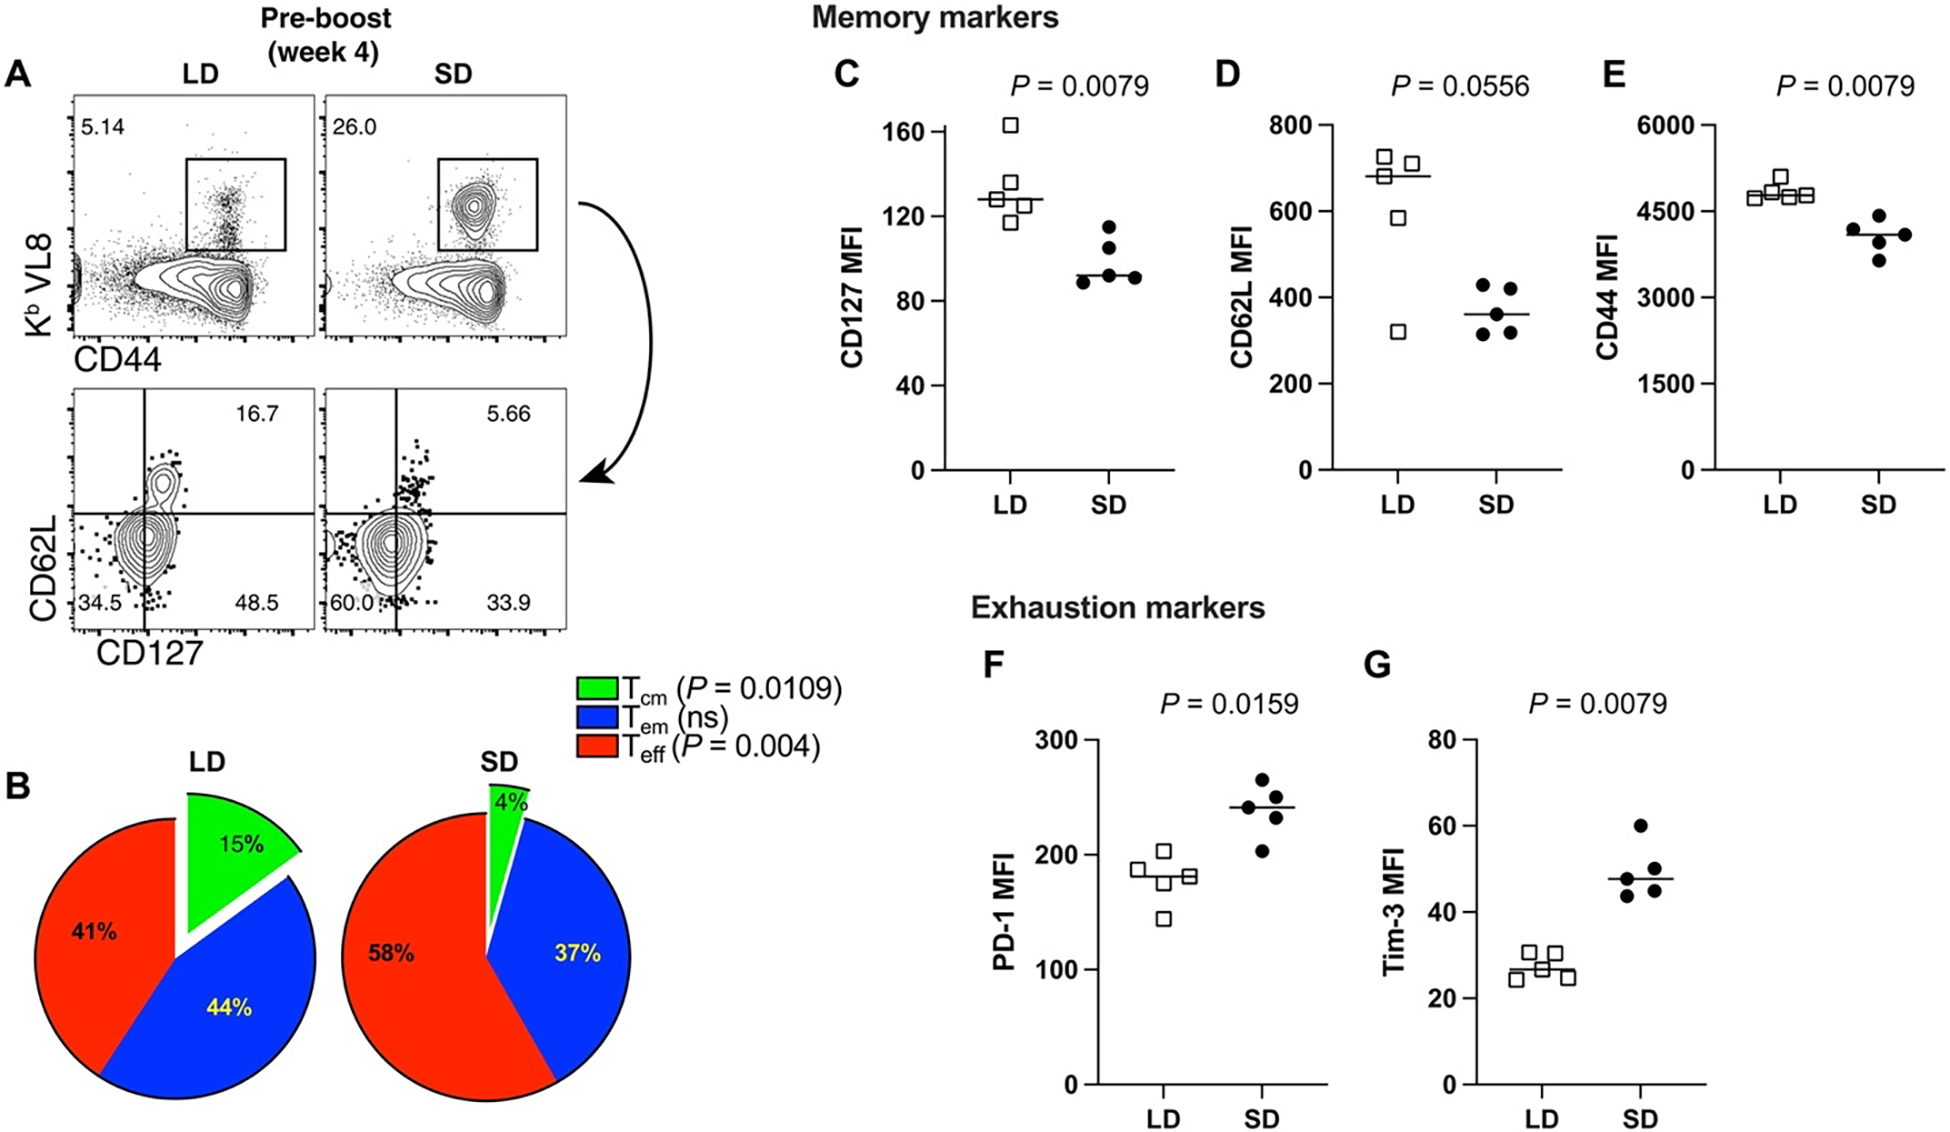
Fig. 3. Phenotype of CD8+ T cell responses after a single prime with the Ad5-SARS-CoV-2 spike vaccine.

(A) Representative FACS plots showing the frequencies of peripheral blood SARS-CoV-2–specific CD8+ T cells (Kb VL8) that differentiate into Tem and Tcm cell subsets. (B) Summary of Teff, Tem, and Tcm cell subsets. (C) CD127 expression. (D) CD62L expression. (E) CD44 expression. (F) PD-1 expression. (G) Tim-3 expression. Data are gated from SARS-CoV-2–specific CD8+ T cells (Kb VL8) from PBMCs. All data are from day 28 after prime. Data are from one experiment with n = 5 per group. Experiment was repeated with similar results (see data file S3). Indicated P values were determined by parametric test (unpaired t test).
