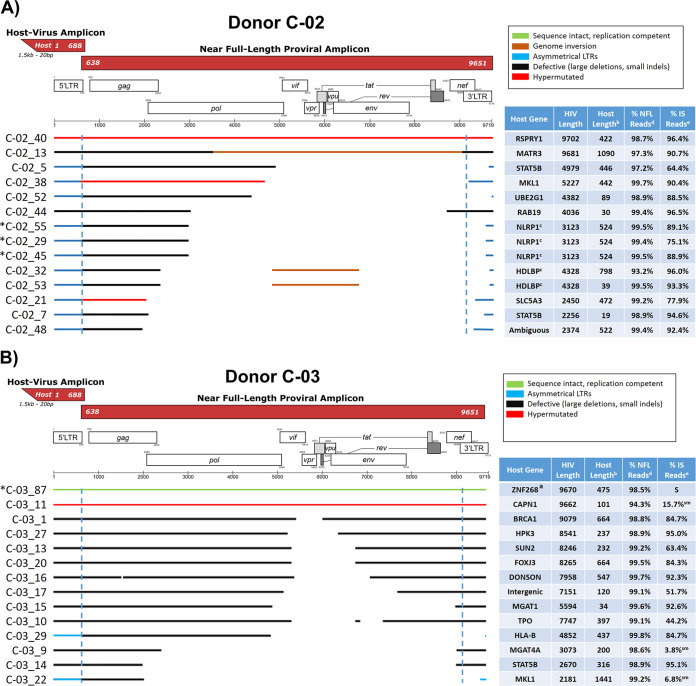
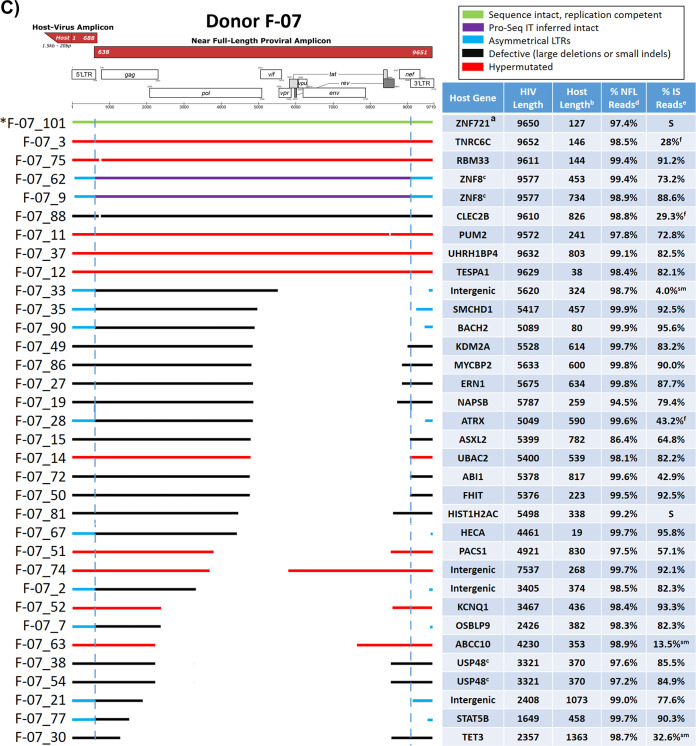
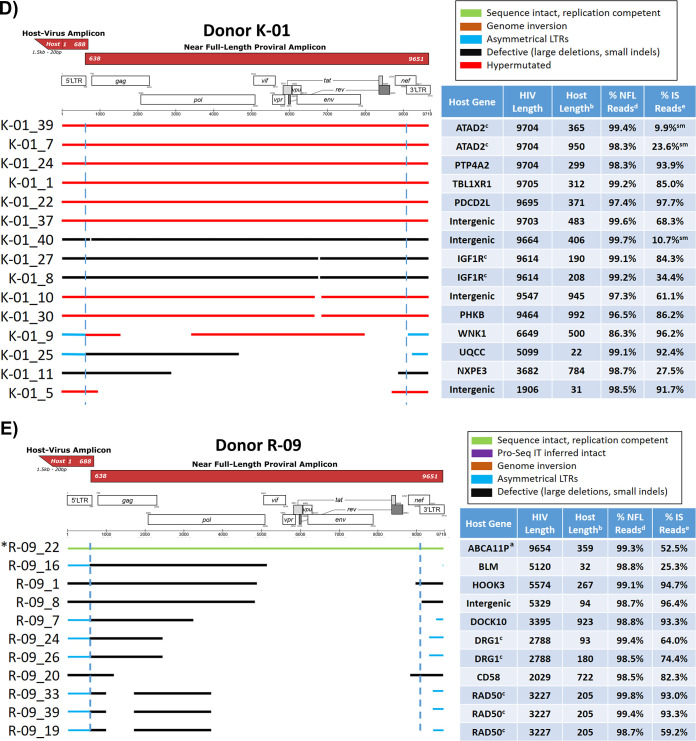
FIG 2.
Virogram alignments of HIV-1 proviruses and integration sites from five subtype B-positive individuals. Alignments of consensus assemblies were performed using MUSCLE. Virograms for individuals C-02 (A), C-03 (B), F-07 (C), K-01 (D), and R-09 (E) are depicted. Green lines indicate proviruses determined to be replication competent by a viral outgrowth assay. Purple lines denote proviruses inferred to be sequence intact by the Proviral Sequence Annotation & Intactness Tool (ProSeq-IT) (29). Brown lines indicate regions containing proviral genome inversions. Blue lines denote proviruses with asymmetrical LTRs. Black lines indicate defective proviruses due to large deletions or small indels. Red lines indicate hypermutated proviruses determined by the Los Alamos Hypermut v2 program (P value of <0.05). Blue dashed lines denote LTR borders. Tables accompanying virograms correspond to the gene locations of proviral integration sites and the lengths of flanking host sequences amplified for the proviruses shown in the virograms. a, replication-competent proviruses determined by a quantitative viral outgrowth assay (qVOA); b, length of the amplified flanking host sequence; c, proviruses in clones identified by identical proviral sequences and integration sites; d, percentage of total reads utilized during the assembly of the near-full-length (NFL) consensus sequence; e, percentage of total reads utilized during the assembly of the host-virus junction consensus sequence; f, amplicons in which 10 ng of a faint band by agarose gel electrophoresis was sequenced; S, integration sites sequenced by dideoxy sequencing only; sm, amplicons in which 10 ng of DNA produced a smear by agarose gel electrophoresis but was successfully sequenced; *, proviruses for which sequence identity was validated by amplification and sequencing of the full-length provirus and flanking host DNA directly from unamplified gDNA. HIV-1 gene map art was adopted from the Los Alamos National Laboratory gene map (40).


