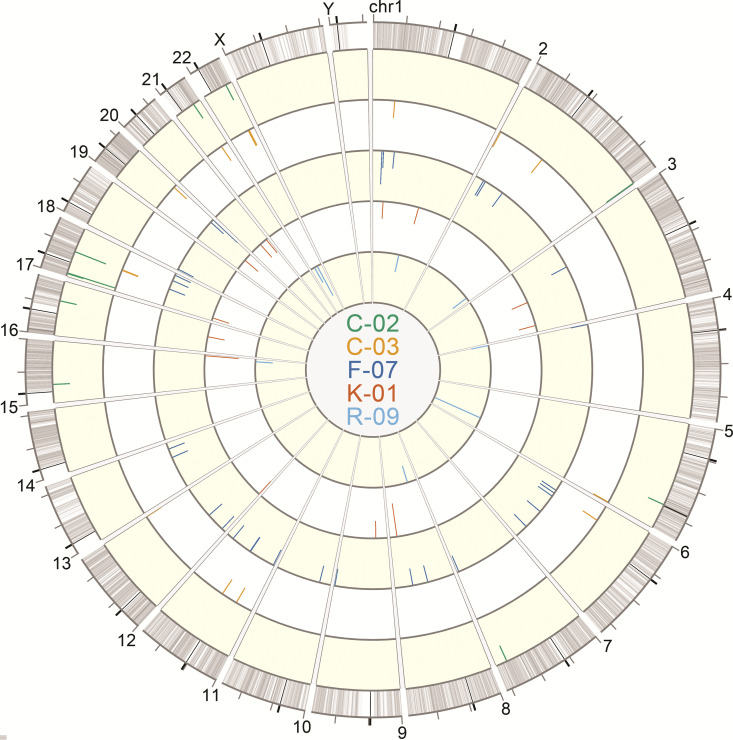
FIG 9.
Circos plot of HIV-1 integration sites of sequenced proviruses. Sequencing reads containing the 5′-host-virus junction were used to extract integration sites from sequencing FASTQ files for alignment against the hg38 consensus genome using the UCSC BLAT tool (37). The Circos plot was generated using Vgas software (38). Each ring depicts integration sites of sequenced proviruses from each donor: C-02 (green), C-03 (orange), F-07 (dark blue), K-01 (red), and R-09 (light blue). The lengths of the tick marks are proportional to the number of times that an identical integration site of a specific provirus was independently amplified and sequenced.

