FIG 1.
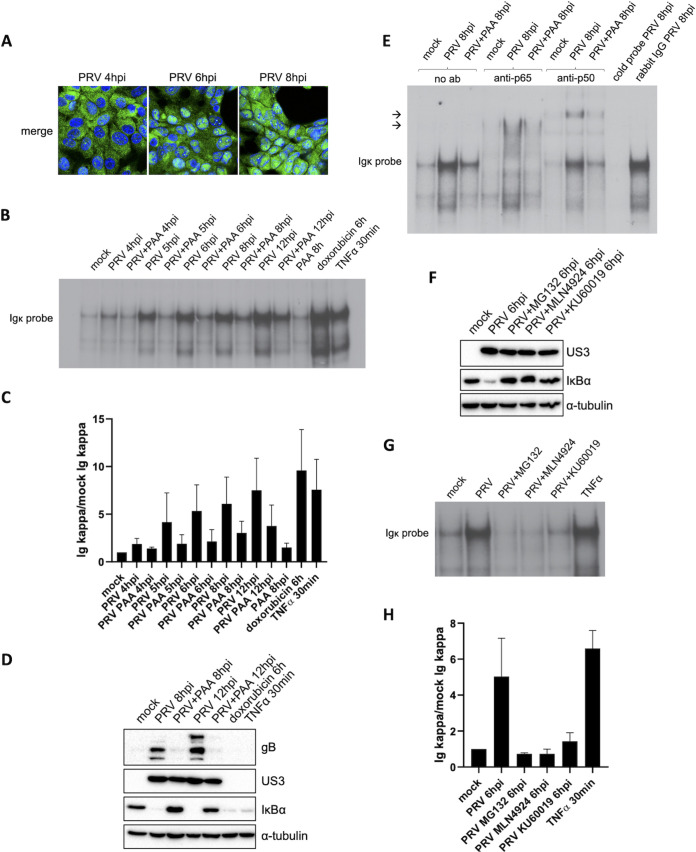
Activated NF-κB in PRV-infected cells contains p65 and p50 and is able to bind κB sites in DNA. (A) Merged confocal microscopy pictures of NF-κB p65 (shown in green) and cell nuclei (shown in blue) in PRV-infected ST cells at 4, 6, and 8 hpi (PRV WT Kaplan, MOI of 10). (B) NF-κB EMSA in PRV-infected ST cells treated or not with 400 μg/mL PAA at 4, 5, 6, 8, and 12 hpi (PRV WT Kaplan, MOI of 10) and in ST cells exposed to 5 μM doxorubicin for 6 h or to 100 ng/mL porcine TNF-α for 30 min. (C) Graph representing the semiquantitative analysis of the intensity of protein bands corresponding to NF-κB-κB complexes in the EMSAs of panel B (set relative to mock-infected cells). Means and standard deviations of the results of three independent repeats of the NF-κB EMSA are shown. (D) Western blot analysis of IκBα in PRV-infected ST cells treated or not with 400 μg/mL PAA at 8 and 12 hpi (PRV WT Kaplan, MOI of 10) and in ST cells stimulated with 100 ng/mL porcine TNF-α for 30 min or 5 μM doxorubicin for 6 h. Detection of the PRV proteins US3 and gB was performed to validate successful PAA treatment. (E) NF-κB supershift EMSAs in mock-infected ST cells and in PRV-infected ST cells at 8 hpi, either treated or not with 400 μg/mL PAA. Supershift assays were performed using anti-p65, anti-p50, or rabbit IgG isotype control antibodies and cold κB probes. Arrows indicate locations of supershifted NF-κB complex bands. (F) Western blot analysis of IκBα in PRV-infected ST cells at 6 hpi, treated or not with 10 μM MG132, 50 μM MLN4924, or 10 μM KU60019. MG132 and MLN4924 inhibitors were added at 2 hpi, and KU60019 was added 30 min before inoculation and kept throughout infection. The PRV US3 protein was detected as infection control. (G) NF-κB EMSA in PRV-infected ST cells at 6 hpi, treated or not with 10 μM MG132, 50 μM MLN4924, or 10 μM KU60019, and in ST cells stimulated with 100 ng/mL porcine TNF-α for 30 min. KU60019 was added 30 min before inoculation and kept throughout infection, while MG132 and MLN4924 were added at 2 hpi. (H) Graph representing the semiquantitative analysis of the intensity of protein bands corresponding to NF-κB-κB complexes in the EMSAs of panel G (set relative to mock-infected cells). Means and standard deviations of the results of three independent repeats of the NF-κB EMSA are shown.

