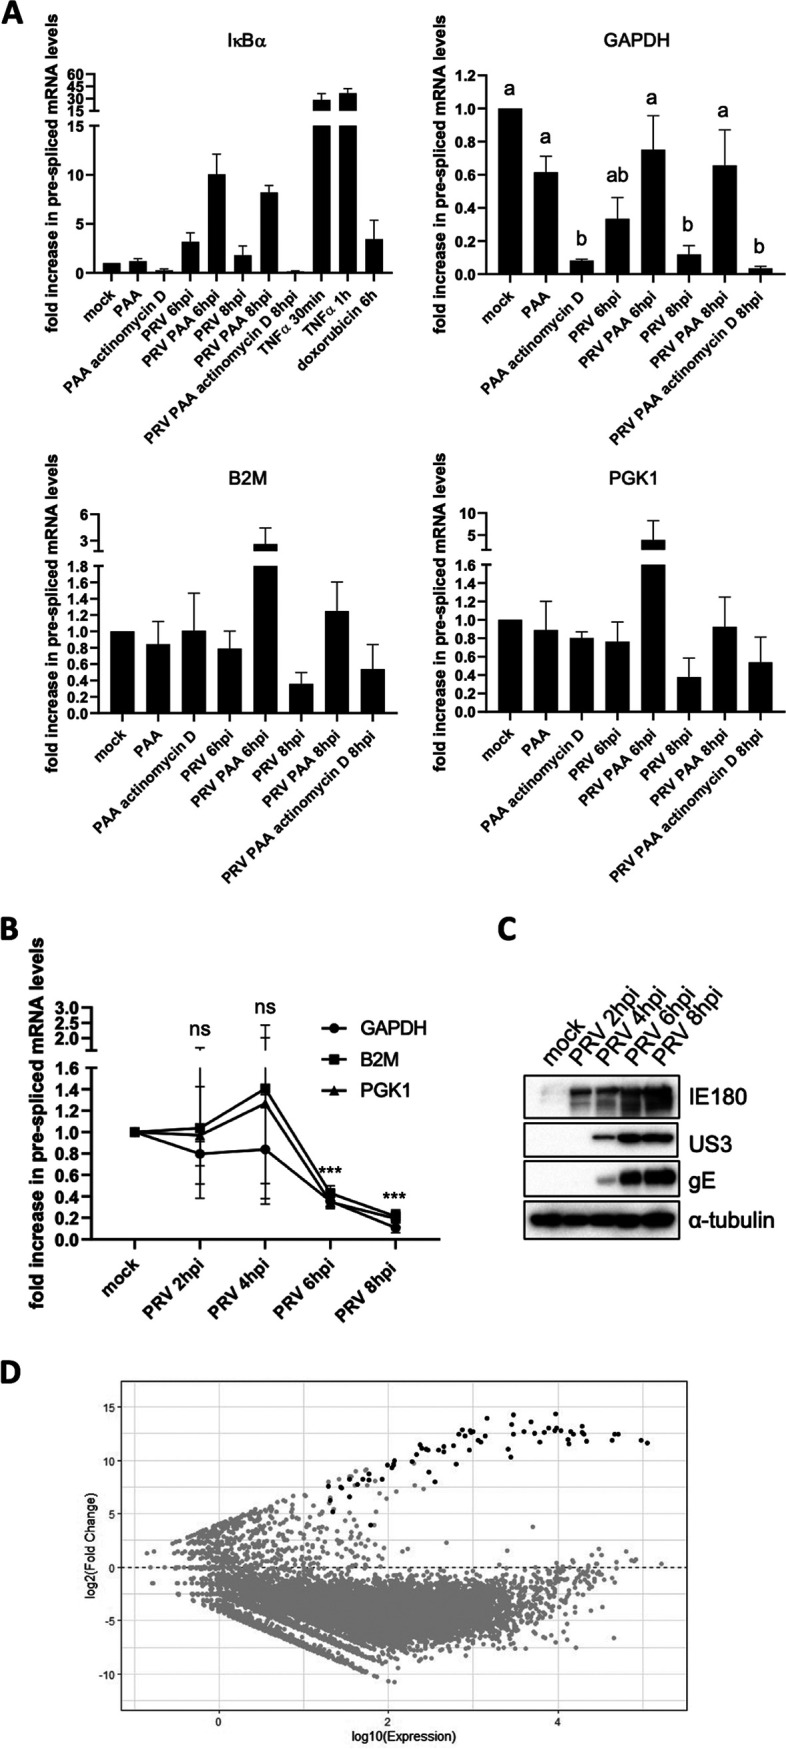
FIG 3.

PRV infection results in broad inhibition of host gene expression. (A) Graphs showing the means and standard deviation of results of three independent repeats of quantification of the fold difference in prespliced transcript levels versus the mock condition, determined via RT-qPCR. Results are shown for prespliced transcripts corresponding to the IκBα, GAPDH, B2M, and PGK1 genes. ST cells were either mock infected or PRV infected (6 and 8 hpi with PRV WT Kaplan, MOI of 10) and treated or not with 400 μg/mL PAA or 5 μg/mL actinomycin D. PAA was added 30 min prior to inoculation and maintained throughout infection, while actinomycin D was added from 6 to 8 hpi. In mock-infected cells, the treatment duration was identical to that in infected cells. As positive controls for IκBα gene transcription, ST cells were treated with 100 ng/mL porcine TNF-α for 30 min or 5 μM doxorubicin for 6 h, respectively. Different letters in the GAPDH graph indicate conditions that are statistically significantly different from each other (P < 0.05). (B) Graphs showing mean and standard deviation of results of three independent repeats of RT-qPCR-based quantification of prespliced mRNA levels corresponding to GAPDH, B2M, and PGK1 genes in PRV-infected ST cells at 2, 4, 6, and 8 hpi (PRV WT Kaplan, MOI of 10). Statistically significant differences in results compared to mock-infected cells are indicated (ns, nonsignificant; ***, P < 0.001). (C) Western blot analysis of the PRV proteins IE180, US3, and gE in PRV-infected ST cells at 2, 4, 6, and 8 hpi (PRV WT Kaplan, MOI of 10). (D) MA plot analysis of RNA-seq data sets of ST cells infected with PRV WT NIA3 at 16 hpi (MOI of 10) compared to transcript levels found in mock-infected cells. Gray dots indicate cellular transcripts, whereas black dots correspond to viral transcripts.
