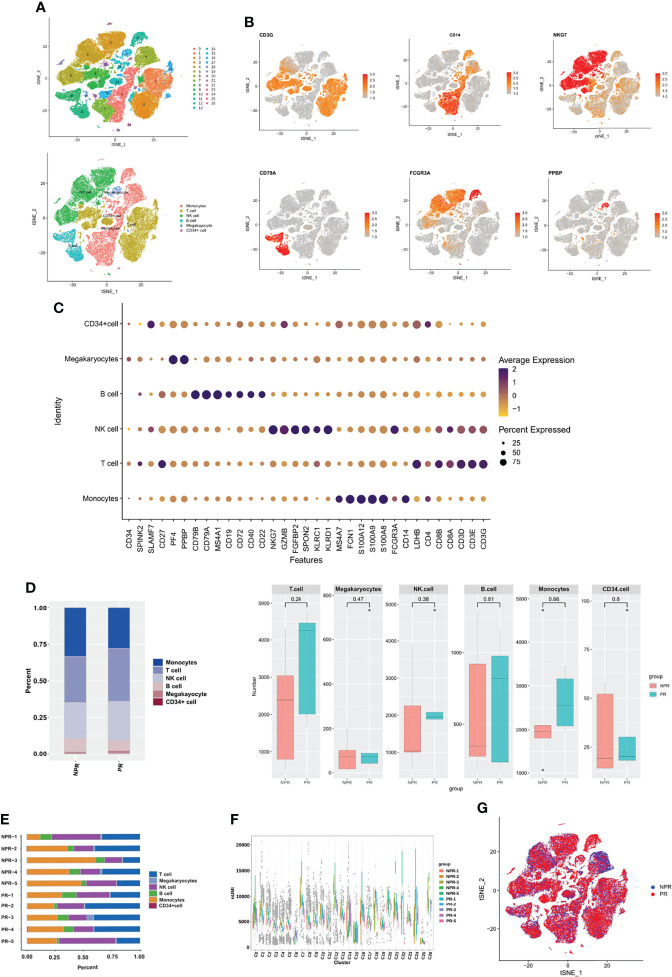
Figure 1.
Circulating immune cell landscape in patients with and without PR. (A) t-SNE plot presenting clustering of total PBMCs reveals 27 clusters and 6 cell types. (B) t-SNE plot of marker genes of each cell type. (C) Dot plot showing the top marker genes revealed by single-cell RNA sequencing of cell types defined in (A). (D) Percentage of cell types and the comparison of cell number in each cell type between PR and NPR. (E) Cell proportion of each patient. (F) UMI number of each cluster. (G) t-SNE plot of patients with PR and NPR.

