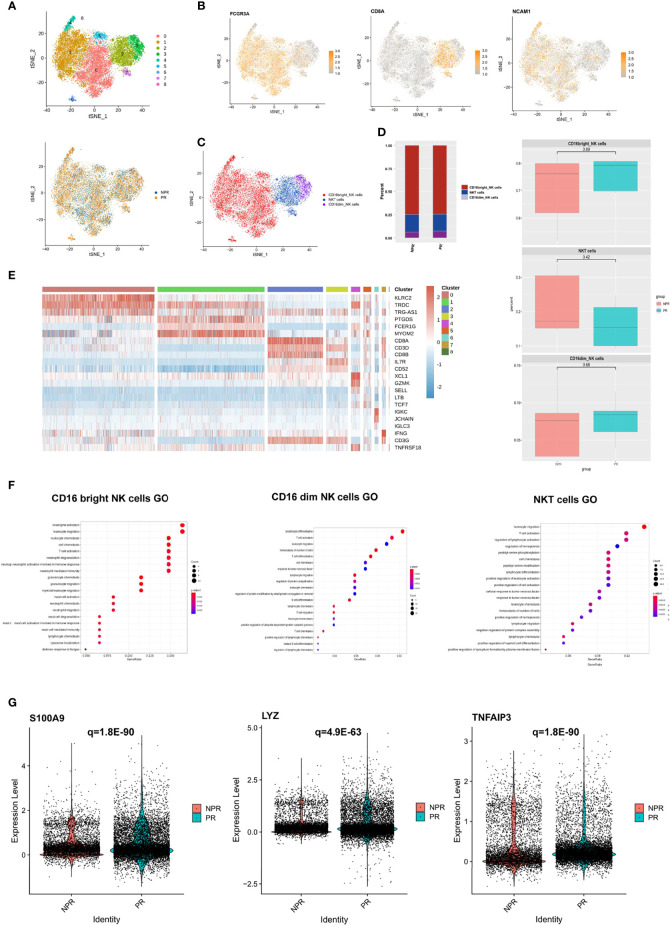
Figure 6.
Characterization of NK cells in patients with and without plaque rupture. (A) t-SNE plot showing the re-clustering of NK cells into 9 clusters and t-SNE plot of patients with PR and NPR. (B) Expression t-SNE plot of NK cell marker genes as FCGR3A, CD8A, and NCAM1. (C) t-SNE plot showing the contribution of different NK cell subsets. (D) Percentage of NK cell subtypes in patients with PE and PR. (E) Heatmap showing expression levels of discriminative genes for each cluster. (F) GO analysis of upregulated genes in CD16bright NK, CD16dim NK, and NKT cells. (G) Expression of pro-inflammatory hub genes such as S100A9, LYZ, and TNFAIP3 were significantly upregulated in CD16bright NK cells of patients with PR.

