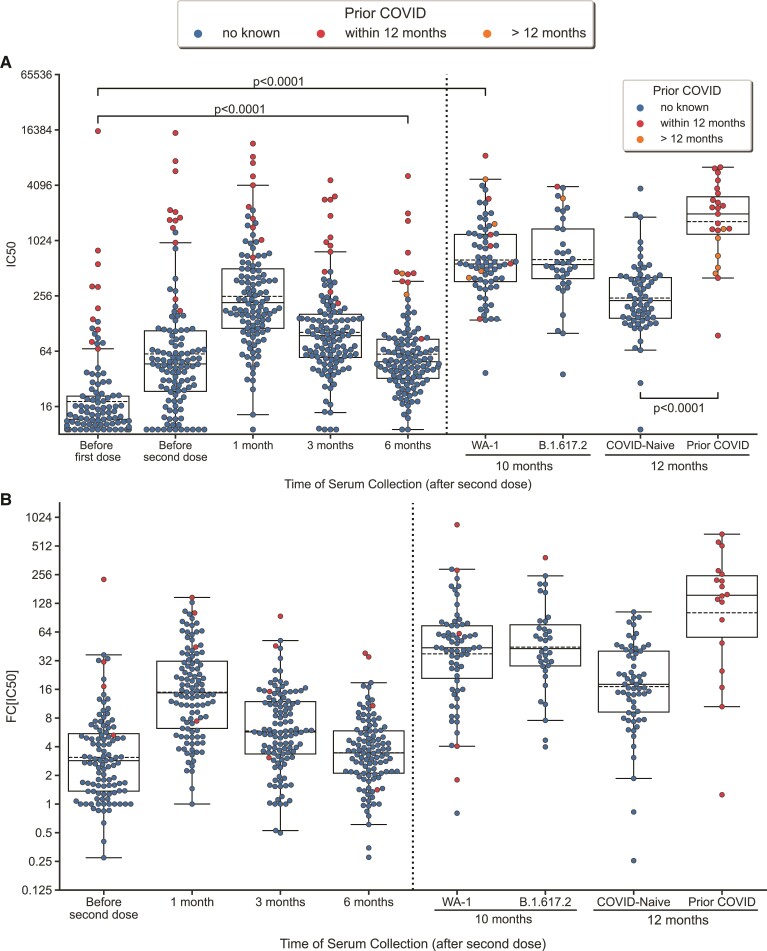
Figure 1.
Neutralization antibody titers following vaccination. A, Swarmplot/boxplot of IC50 plotted over time before and after vaccination, second dose, and third dose. Boxplot shows median, lower/upper quartile, and extremes. B, Swarmplot/boxplot of fold-change (FC[IC50]) over pre-vaccination IC50 plotted over time after the first dose of vaccine. A values are derived from paired A test. Outliers, values further than 1.5 times the interquartile range (Q1–1.5*IQR and Q3+1.5*IQR), are shown beyond the boxplot. Subjects with COVID prior to first dose of vaccination were excluded in figure 1A because it artifactually lowers the fold-change. The 1- month time point was 1 month post third dose. The 12-month timepoint was 3 months post third dose.

