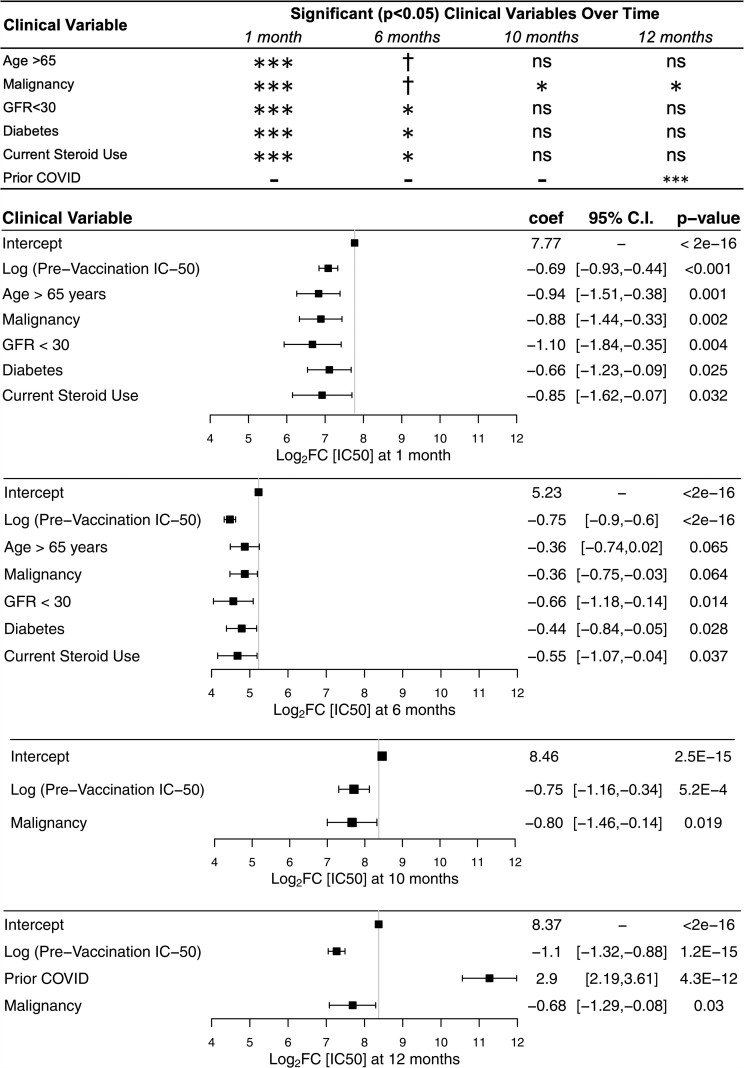
Figure 4.
Multivariable linear regression of clinical variables associated with neutralizing antibody response. Summary plot (top) showing variables retained in the stepwise regression with corresponding significant P values. Nonsignificance denoted by “ns”, P value between .10 and .05 denoted by †. P value between .05 and .01 denoted by ∗. P value between .01 and .001 denoted by ∗∗. P value less than .001 denoted by ∗∗∗. Log2FC = log normalized fold-change over prevaccination IC50. Forest plots showing multivariable linear regression variables of response at 1, 6, 10, and 12 months following administration of second dose. Variables not reaching significance not shown in the figure are sex, race, chronic heart disease, lung disease, liver disease, current steroid use, cerebrovascular disease, HIV-Transplant-Rheum, and dementia. Intercept represents baseline comparison values: age less than 65 years, GFR greater than 60 mL/min/1.73 m2, no steroid use, and no comorbidities. The 10-month time point was 1 month after the third dose. The 12-month timepoint was 3 months after the third dose. GFR, glomerular filtration rate; IC50, half maximal inhibitory concentration.

