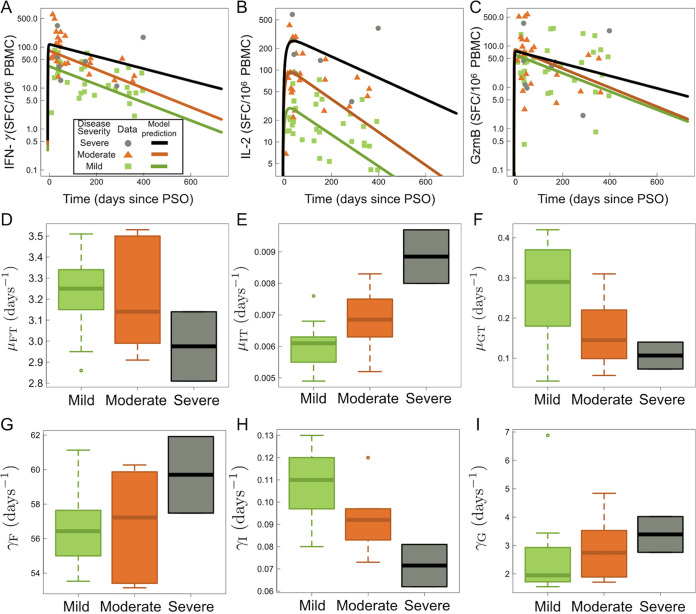
FIG 6.
Kinetic model (equations 1 to 8) results sorted by severity. Clinical data in panels A to C are separated by case severity: severe, moderate, and mild. (A) IFN-γ data and fits to equation 7 as a function of days since PSO. (B) IL-2 data and fits to equation 6 as a function of days since PSO. (C) GzmB data and fits to equation 8 as a function of days since PSO. Panels D to I show boxplots of model fitted parameters for equations 6, 7, and 8 sorted by case severity. (D) IFN-γ stimulation rate by CD4+ T cells, μFT, for mild, moderate, and severe disease. (E) IL-2 stimulation rate by CD4+ T cells, μΙΤ, for mild, moderate, and severe disease. (F) GzmB stimulation rate by CD4+ T cells, μGT, for mild, moderate, and severe disease. (G) IFN-γ degradation rate, γF, for mild, moderate, and severe disease. (H) IL-2 degradation rate, γI, for mild, moderate, and severe disease. (I) GzmB degradation rate, γG, for mild, moderate, and severe disease.

