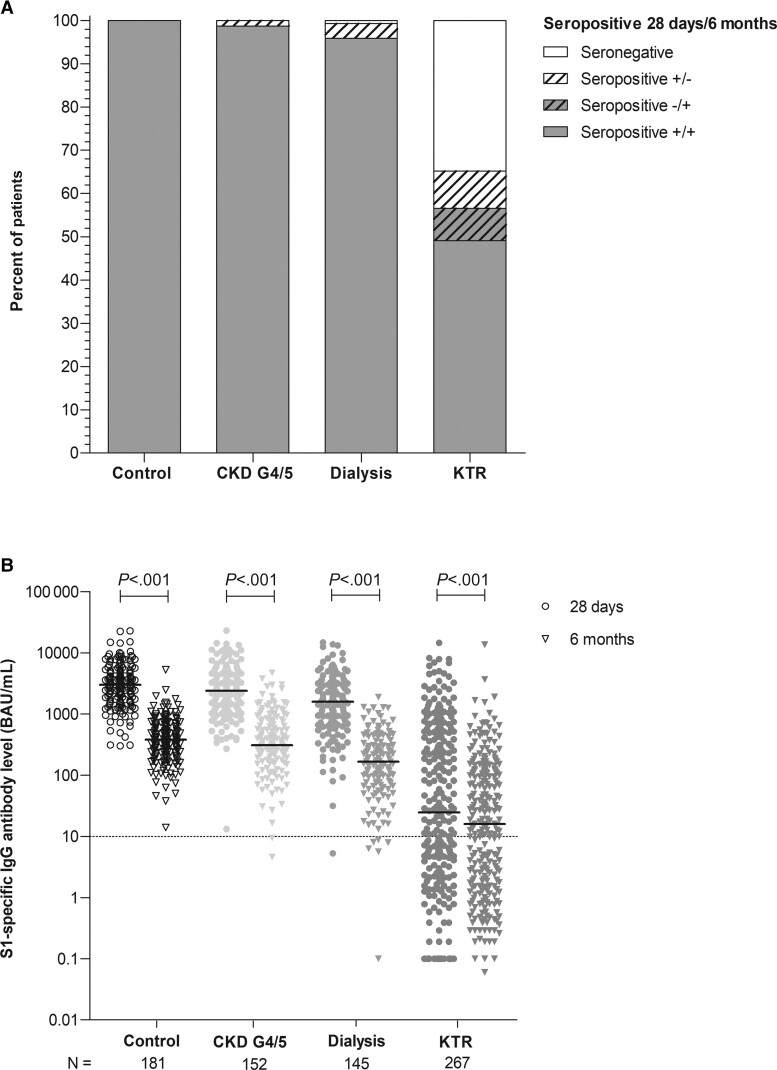
Figure 2.
Seroconversion rate (A) and S1-specific IgG antibody levels (B) at day 28 and month 6 after second coronavirus disease 2019 vaccination per cohort. Depicted are scatter dot plots with a line indicating the median level. P values were calculated using the Wilcoxon signed rank test. Abbreviations: BAU/mL, binding antibody units per milliliter; CKD G4/5, chronic kidney disease stages 4/5; IgG, immunoglobulin G; KTR, kidney transplant recipient.

