Fig. 1.

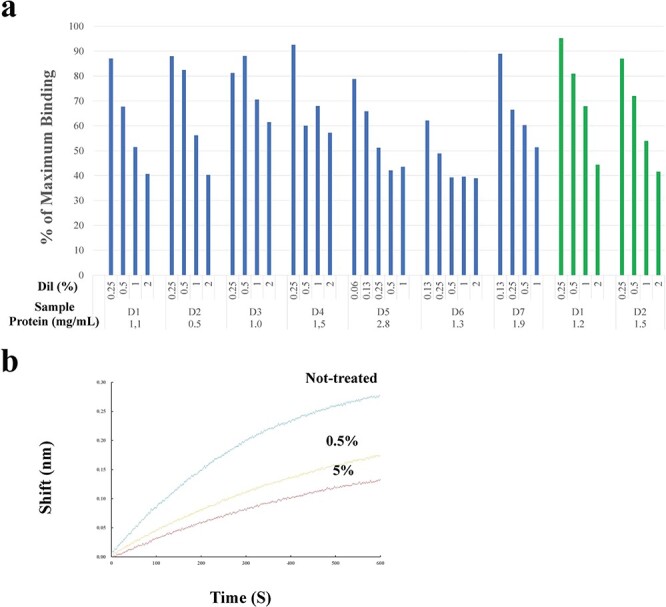
Effects of saliva and tears on S1-ACE2 binding. a. ELISA. Saliva (blue bars) and tears (green bars) were diluted with PBS and incubated with ACE2 immobilized in wells, which were then incubated with S1. Bound S1 was optically quantified. The extent of S1 binding (vertical axis) was expressed as the % maximum binding (the ratio of OD in the presence of saliva/tears against that in its absence). ‘D’ represents the donor who provided the saliva or tears. The numerals shown under each bar indicate the dilution rate [Dil (%)] (0.25%–2%) of each test sample and those at the bottom of the abscissa represent the concentrations (μg/ml) of the original (non-diluted) samples. Saliva was tested for 11 donors. Data from seven cases are depicted here. Tears were tested for two donors. b. BLI assay. ACE2-immobilized sensors were pretreated with diluted saliva from done #7: the blue, yellow and red lines represent non-treated, diluted to 0.5% and 5%, respectively. The concentration of the original saliva was 3.2 mg/ml. The sensors were then incubated with 5 nM of S1 and the amount of S1 bound to the sensors were determined. The BLI assay was performed twice, which yielded similar results and one of these is presented here.
