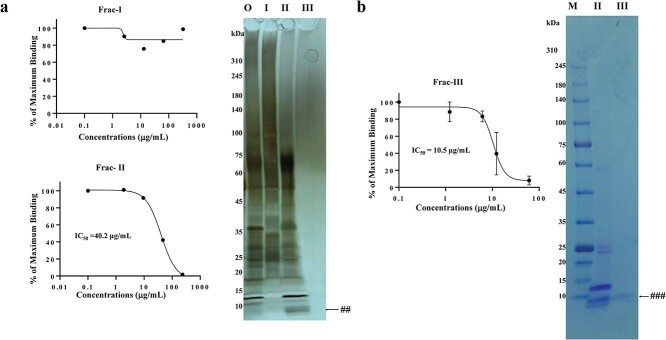
Fig. 2.
Inhibition of S1-ACE2 binding by UF-fractionated fractions. a. Frac-I, II and III were prepared from donor #1 saliva on a small scale were subjected to ELISA at the indicated concentrations. The ELISA was conducted three times. No inhibition was observed for Frac-I and typical inhibition curves were obtained for Frac-II. The calculated IC50 value of Frac-II was 40.2 μg/ml. The proteins of these fractions together with original (O, unfractionated) were separated by SDS-PAGE by loading 1-μg protein for O, I, II and III and stained by silver (right panel). ## indicates the band corresponding to the band indicated by the blue arrowhead in Fig. 3b. M, MW markers. b. Frac-II and III were prepared from Donor #1 saliva at a larger scale. ELISA experiments (left panel) showed that Frac-III exhibits a sigmoidal inhibition curve with an IC50 value of 10.5 μg/ml. The right panel showed CBB-stained SDS-PAGE of these Frac-II (II) and III (III), in which portions of 10 μl containing 558 μg/ml protein (Frac-II) and 58.9 μg/ml of protein (Frac-III) were analysed. ### indicates the band corresponding to the band indicated by ## in a II and the blue arrowhead in Fig. 3b. M, MW markers.

