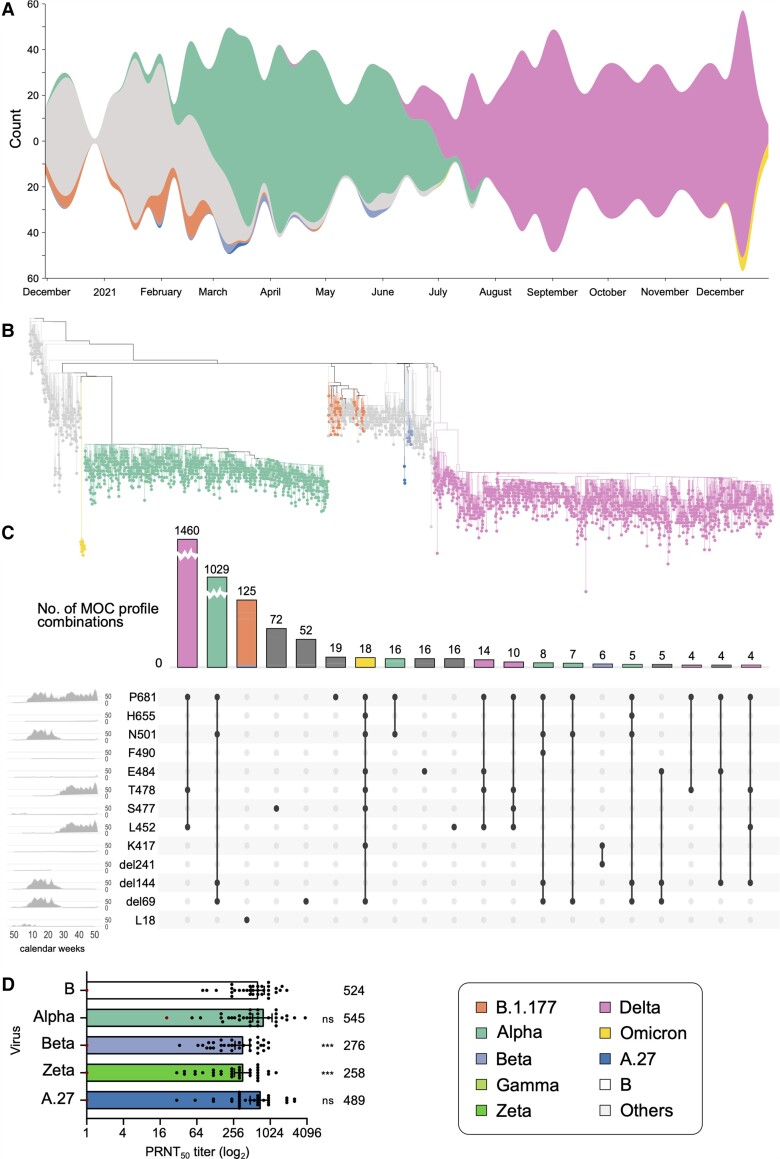
Figure 2.
A, Variant proportions over time, as captured in the representative sampling subset of Integrated Molecular Surveillance for SARS-CoV-2 (IMS-SC2) laboratory network genome sequences. To visualize the dynamics in the virus population over time, virus lineages were determined with pangolin based on the randomly sampled genome sequences (n = 3282, see Materials and Methods). Lineage frequencies were aggregated based on the date of sampling relative to calendar weeks. Missing values have been interpolated. Visualization was performed using RAWGraphs. Please see Supplementary Figure 1 for a detailed visualization including non–variants of concern (VOCs). B, Phylogenetic tree highlighting VOC clades. Sequencing data presented here are based on all randomly selected severe acute respiratory syndrome coronavirus 2 (SARS-CoV-2)–positive specimens from the IMS-SC2 network (n = 3282). Lineage B.1.177 is also shown as an early variant that emerged in Europe in early summer 2020 as well as 3 A.27 samples. Please see Supplementary Figure 2 for the full tree visualization, including the 2 long branch attractions described in the Supplementary Methods. C, Mutation of concern (MOC) proportions and combinations over time, as captured by the randomly sampled IMS-SC2 genomes. MOCs shown here highlight the spike amino acid positions, rather than the specific exchanged amino acid, as the selected positions can have >1 amino acid substitution. We constructed an UpSet diagram to visualize the 20 most common intersecting sets, ie, shared MOCs among the randomly selected IMS-SC2 sequences. For selected MOCs, the diagram shows all intersections (specific mutation profiles) and the number of IMS-SC2 sequences that harbor these profiles. On the leftmost panel, we show the frequencies of specific MOCs over time (x-axis: calendar weeks). For selected mutation profiles, we also show the distribution of SARS-CoV-2 lineages. For additional information on the selected mutations, please see Supplementary Figure 3 and Supplementary Table 3. D, Assessing the susceptibility of SARS-CoV-2 variants to neutralization. Thirty-four sera drawn from individuals vaccinated twice with the BNT162b2 vaccine were assessed for their capacity to neutralize different SARS-CoV-2 isolates in vitro. Bars represent the geometric mean plaque reduction neutralization test (PRNT50) titer and 95% confidence intervals. The red dot–marked patient in (A) is immunosuppressed and not included in the statistical analysis. The geometric mean titer is indicated above each bar. Significance was determined by 2-way analysis of variance. ***P < 0.001; ns, not significant.

