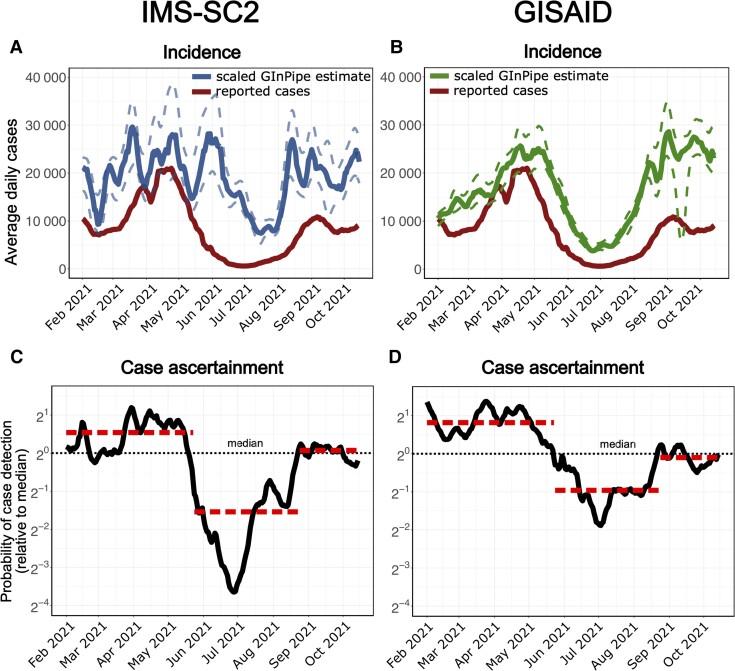
Figure 3.
A and B, Reported severe acute respiratory syndrome coronavirus 2 (SARS-CoV-2) cases in Germany (rolling average, red line) and genome-based incidence estimation using GInPipe [39]. A, The solid and dashed blue lines depict the median trajectory and its 5th to 95th percentile of GInPipe’s incidence estimate using only Integrated Molecular Surveillance for SARS-CoV-2 (IMS-SC2) laboratory network data (3282 sequences, random set). B, The solid and dashed green lines depict the corresponding estimates using all available German sequences deposited in GISAID (226 316 sequences). C and D, Predicted changes in case ascertainment using GInPipe with the IMS-SC2 data (C), as well as all available German sequences deposited in GISAID (D). Case ascertainment is centered on the median case ascertainment probability.

