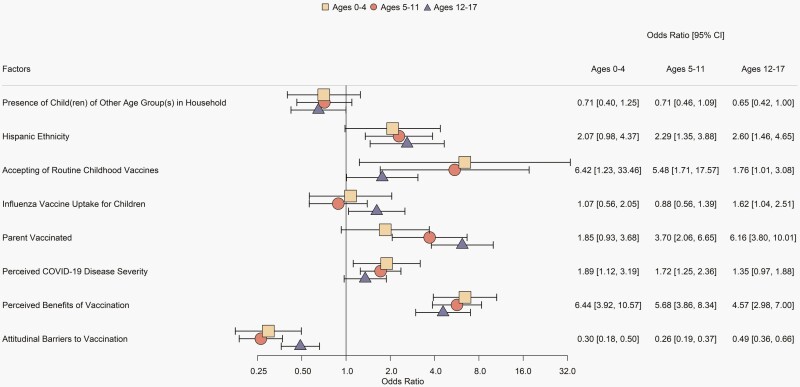
Figure 3.
Predictors of respondents’ willingness to have their children receive a COVID-19 vaccine. Forest plot for odds ratio of having a child vaccinated against COVID-19 with 95% confidence intervals based on weighted multivariable logistic regression. Figure includes effects that were statistically significant (P < .05) for at least one age group.

