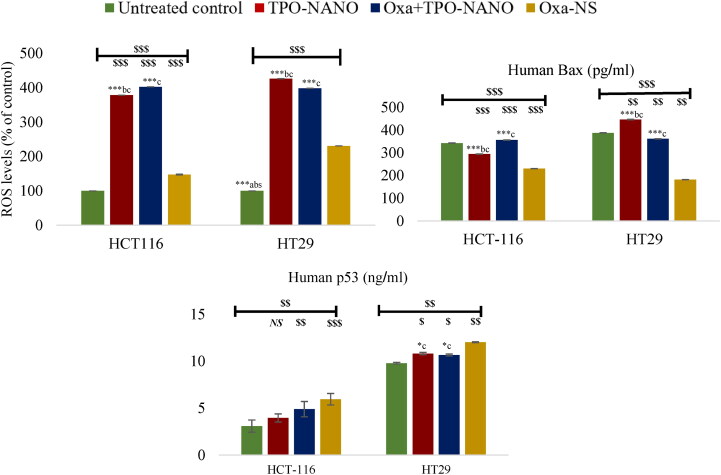
Figure 8.
ROS concentration in HCT 116 cells after 24 h of exposure to 0.6 % (v/v) TPO-NANO, 0.6 µM Oxa-NS, and their combination (Oxa + TPO-NANO); and ROS levels in HT-29 cancer cell lines exposed for 24 h to 0.3 % (v/v) TPO-Nano, 0.3 µM Oxa-NS, and their combination (Oxa + TPO-NANO). The percentage change in fluorescence intensity of treated cells was quantified relative to untreated control. Data are expressed as mean ± SD; n = 3. $P ≤ 0.05, $$p ≤ 0.001, $$$p ≤ 0.0001, versus control; NSp < 0.05, versus control. *Significant differences amongst the treated groups (*p ≤ 0.05, **p ≤ 0.001, ***p ≤ 0.0001; a, b, c represent Oxa-NS, TPO-NANO and Oxa + TPO-NANO, respectively.

