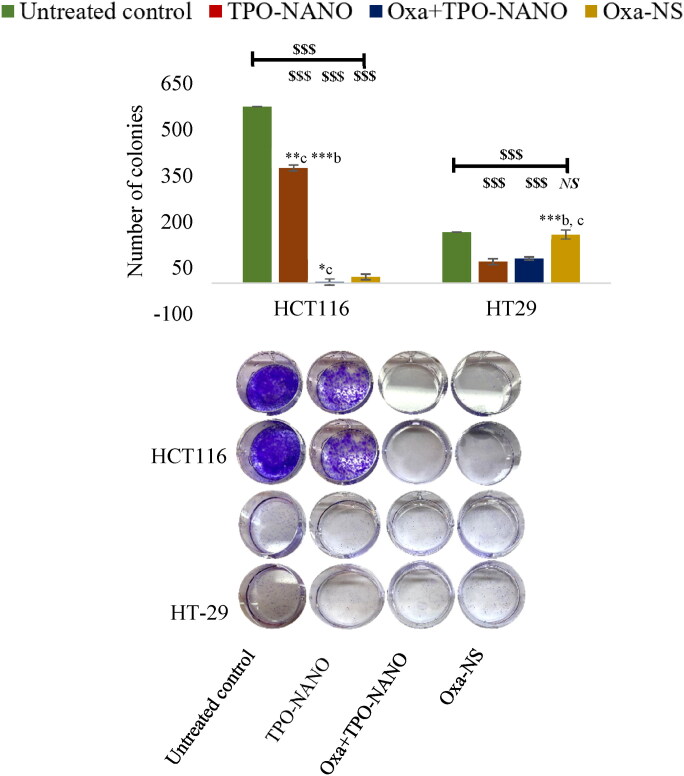
Figure 9.
Inhibition of HCT116 cells after exposure to 0.6 % (v/v) TPO-NANO, 0.6 µM Oxa-NS, and their combination (Oxa + TPO-NANO), and inhibition of HT-29 colony growth after treatment with 0.3 %(v/v) TPO-Nano, 0.3 µM Oxa-NS, and their combination (Oxa + TPO-NANO) for 24 h. The colonies were allowed to grow for 7 days in normal media. The numbers of colonies were calculated relative to the untreated control, and the values are presented as mean ± SD (n = 3). $$$P ≤ 0.0001, versus control; NSp < 0.05, no significant difference from control. *Indicates significant differences amongst the groups (*p ≤ 0.05, **p ≤ 0.001; ***p ≤ 0.0001). a, b, c represent TPO-NANO, Oxa + TPO-NANO and Oxa-NS, respectively.

