
Figure 1.
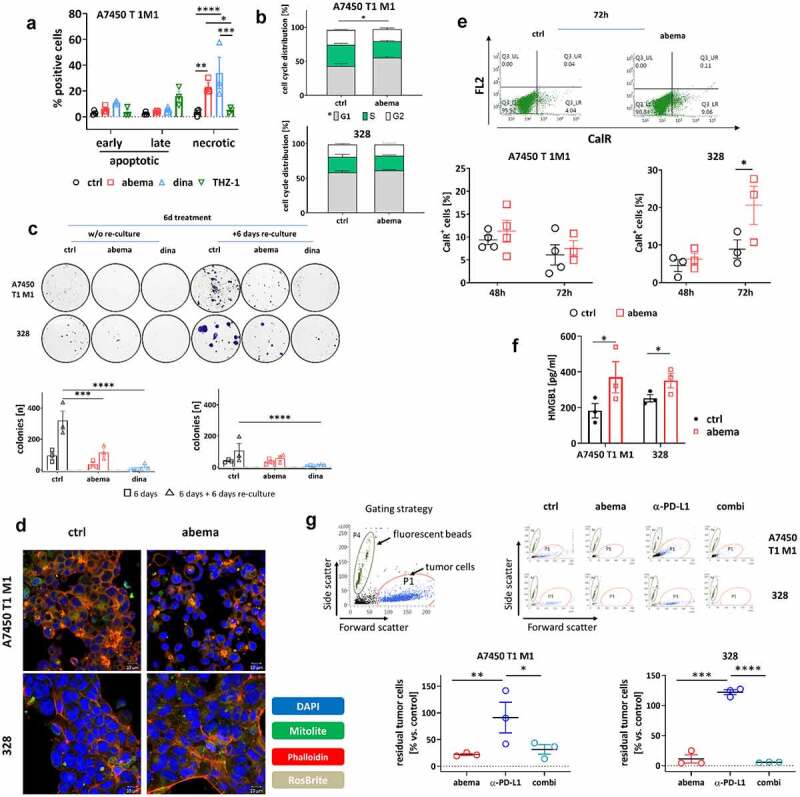
In vitro analysis on Mlh1−/− tumor cells. (a) Apoptosis/necrosis quantification. Mlh1−/− A7450 T1 M1 tumor cells were treated with CDKIs for 72 h and apoptosis/necrosis was quantified from Yo-Pro1/PI-stained cells. n = 3 independent experiments, *p < .05; ** p > .01; ***p < .001; two-way ANOVA (Tukey’s multiple comparisons test). (b) Cell cycle analysis after 48 h of treatment with abemaciclib. n = 4 independent experiments, *p < .05; t-test. (c) Colony formation assay after treatment with abemaciclib or dinaciclib. Two experimental conditions were studied: (i) 6 days treatment and direct analysis and (II) 6 days treatment + 6 days re-culture without (w/o) treatment (= reconvalescence). Thereafter, colonies were counted using ImageJ software. n = 3 independent experiments, *p < .05; ***p < .001; ****p < .0001; two-way ANOVA (Tukey’s multiple comparisons test). (d) Detection of ROS (RosBrite), cytoskeleton (Phalloidin) and mitochondria (mitolite) after 48 h of treatment with abemaciclib. Representative images are shown out of n = 3 independent experiments. Read out was done with the ZEISS Elyra 7 Confocal Laser Microscope (Zeiss). Original magnification 400 x. (e) Flow cytometric measurement of CalR-positive cells after 48 h and 72 h of treatment. n = 3–4 independent experiments. (f) HMGB1 secretion after 72 h of treatment. HMGB1 levels were determined from supernatants of MLH1−/− tumor cells. Control cells were left untreated. Experiments were repeated three times each of them performed in duplicates. *p < .05. (g) Co-culture of tumor and immune cells. Tumor and immune cells were simultaneously treated for 1 × 72 h with abemaciclib, α-PD-L1 antibody or a combination. The effector to target ratio was 1:10. Residual tumor cells were counted by adding fluorescent beads. Read out was done via flow cytometry. Representative dot plots of tumor cells treated with immune cells and drugs are shown. n = 3 independent experiments, *p < .05; **p < .01, ***p < .001; ****p < .0001, One-way ANOVA (Tukey’s multiple comparisons test). (a-g) All data are given as mean + SEM. Doses used in each experiment are as follows: abemaciclib: 1 µM, dinaciclib: 0.1 µM, THZ-1: 0.83 µM; α-PD-L1 antibody: 10 µg/ml.