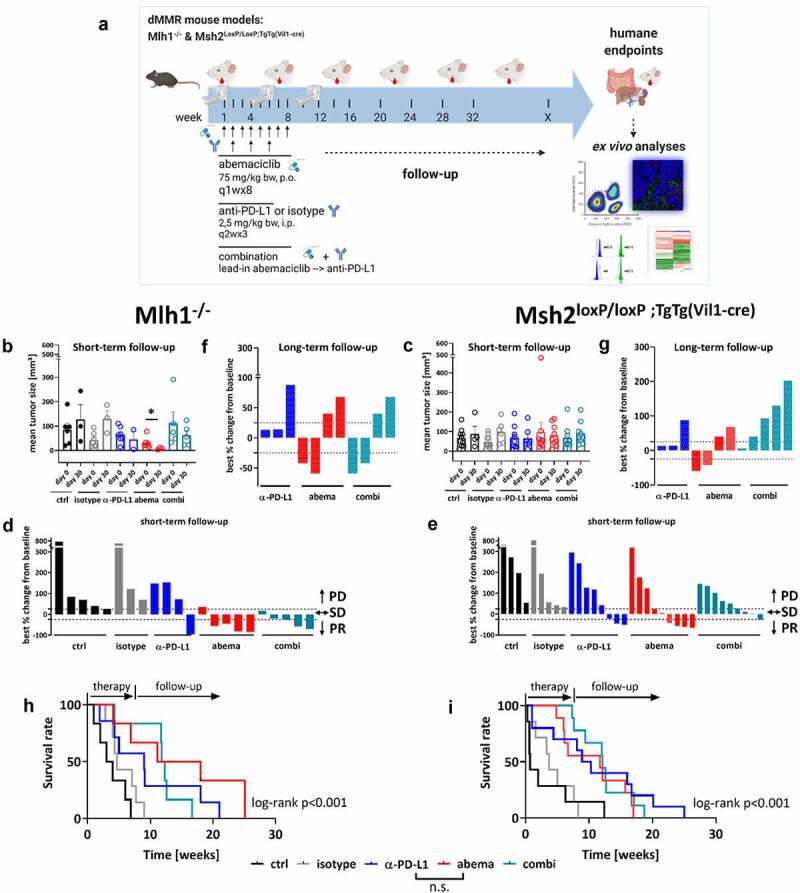
Figure 2.

Treatment schedule, longitudinal18F-FDG PET/CT imaging in vivo and overall survival of Mlh1−/− and Msh2loxP/loxP;TgTg(Vil1−cre) mice. (a) Experimental protocol. Mice with gastrointestinal tumors were conducted to mono- or combination therapy. Abemaciclib: 1x/week, 8 times in total (q1wx8); α-PD-L1: biweekly, 3 times in total (q2wx3); combination: abemaciclib first (=lead-in), followed by α-PD-L1 injection. (b – g) Baseline and follow-up PET/CT imaging of individual mice. (b, c) Data are presented in column (each dot stands for an individual mouse). (D, E, F, G) data are presented as best % change from baseline according to clinical definitions and depicted for each individual mouse either after short-term (day 30) (d, e) or long-term follow-up (~day 50) (f, g); PD – progressive disease (tumor volume > 25% vs. baseline), SD – stable disease (tumor volume similar to initial staging (≤ 25% vs. day 0); PR – partial response (tumor volume 50% lower or more vs. baseline). (h, i) Kaplan-Meier survival curve. Mlh1−/−: isotype vs. α-PD-L1: p < .05; control vs. abemaciclib: p < .01; control vs. combination: p < .01; ctrl: n = 6, isotype: n = 7, α-PD-L1 n = 7, abemaciclib: n = 6, combination n = 6. Msh2loxP/loxP VillinCre: isotype vs. α-PD-L1: p < .05; control vs. abemaciclib: p < .01; control vs. combination: p < .001. ctrl: n = 10, isotype: n = 7, α-PD-L1 n = 10, abemaciclib: n = 9, combination n = 9. Log-rank analysis (Mantel Cox).
