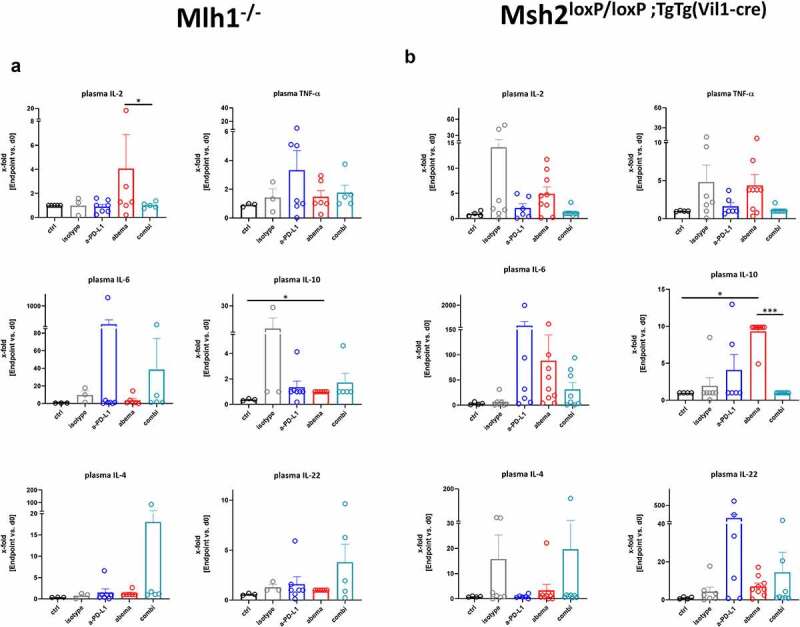
Figure 3.

Cytokine levels of plasma from Mlh1−/− and Msh2loxP/loxP;TgTg(Vil1−cre) mice. (a) Mlh1−/− and (b) Msh2.loxP/loxP;TgTg(Vil1−cre) Plasma samples were collected before treatment (= baseline) and at the experimental endpoint. Cytokine levels were determined as described in material and methods. Given is the x-fold change of the indicated marker in comparison to day 0 (= baseline). Mlh1−/−: ctrl: n = 3, isotype: n = 3, α-PD-L1 n = 7, abemaciclib: n = 6, combination n = 5. Msh2loxP/loxP VillinCre: ctrl: n = 4, isotype: n = 7, α-PD-L1 n = 6, abemaciclib: n = 9, combination n = 8. *p < .05; ***p < .001, Kruskal-Wallis test (Dunn’s multiple comparisons test). (a-b) All data are given as mean + SEM.
