
Figure 4.
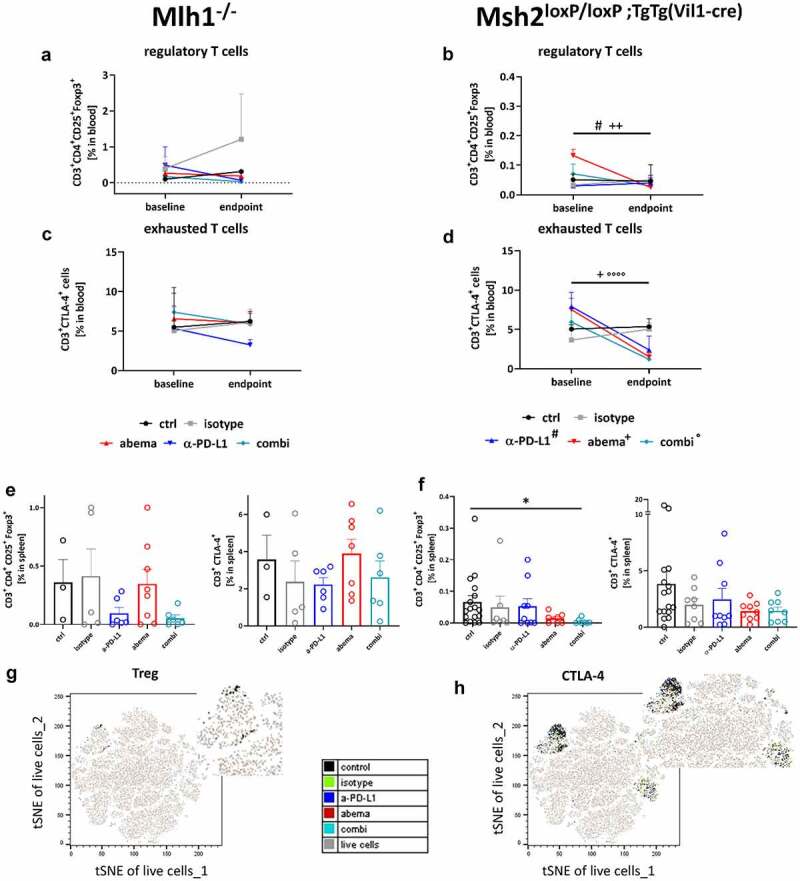
Spectral flow cytometry of peripheral blood and spleens from Mlh1−/− and Msh2loxP/loxP;TgTg(Vil1−cre) mice. (a – d) Blood phenotyping. Given is the number of % immune cells before treatment (= baseline) and at the experimental endpoint resulting from 100,000 events measured on a flow cytometer. Mlh1−/− n = 3–8 mice/group, Msh2loxP/loxP;TgTg(Vil1−cre) n = 7–9 mice/group. #p < .05 endpoint vs. day 0 α-PD-L1; +p < .05 endpoint vs. day 0 abemaciclib; ++p < .01 endpoint vs. day 0 abemaciclib, °°°°p < .0001 endpoint vs. day 0 combination. Kruskal-Wallis test (Dunn’s multiple comparisons test). (e – h) Spleen phenotyping. Given is the number of % immune cells at the experimental endpoint resulting from 100,000 events measured on a flow cytometer. *p < .05; Kruskal-Wallis test (Dunn’s multiple comparisons test). (g, h) tSNE plots showing single T cell subpopulations of spleens from Msh2loxP/loxP;TgTg(Vil1−cre) mice. The expression profile of the exhaustion marker CTLA-4 as well as Tregs were illustrated for the treatment and control groups, respectively.