
Figure 5.
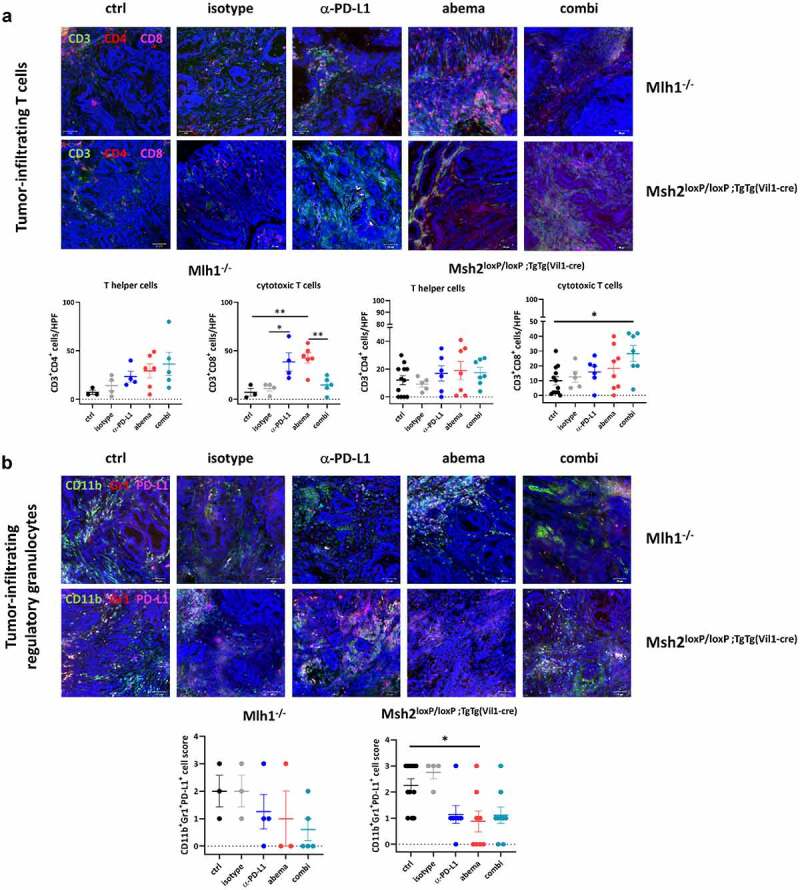
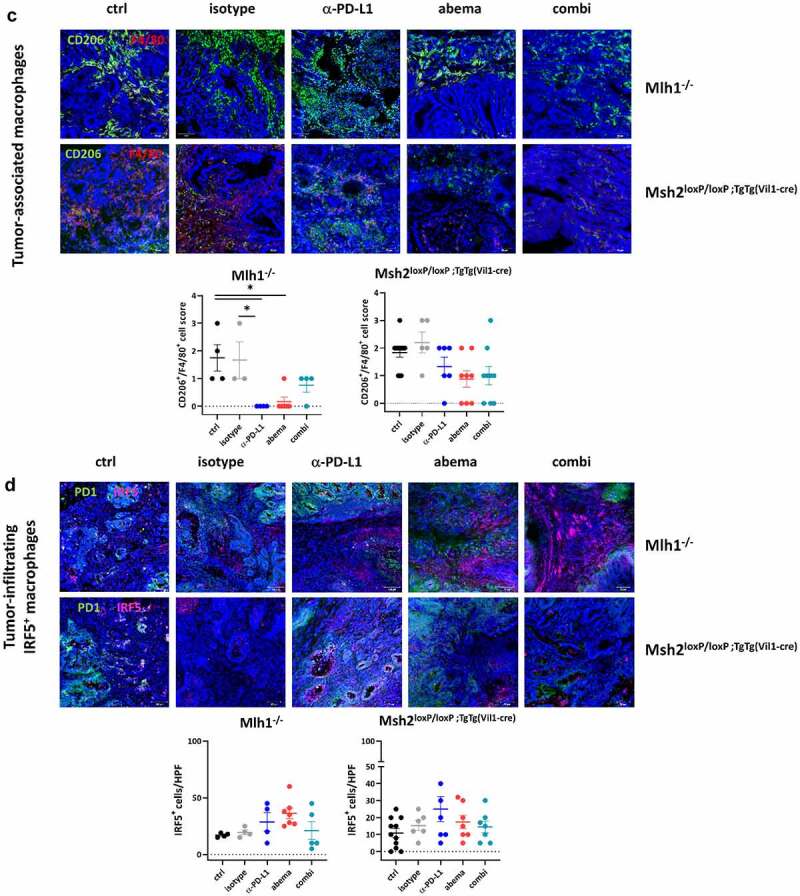
Immunofluorescence of tumor specimens from Mlh1−/− and Msh2loxP/loxP;TgTg(Vil1−cre) mice. Residual tumor slides were fixed, stained and embedded. Confocal laser scanning microscopy was done on a Zeiss Elyra 7 microscope. The infiltration pattern of T cells, regulatory and tumor-associated macrophages differed between individual treatment groups. In most cases, the differences reached statistical significance. Upper panel: representative images of tumor slides; lower panel: quantitative analysis of tumor-infiltrating immune cells. (a, d) Given is the number of infiltrating CD3+CD4+ T helper cells, CD3+CD8+ cytotoxic T cells and IRF5+ macrophages counted in 2–3 HPFs/slide with n = 3–10 mice/group. (b, c) The infiltration pattern was semi-quantitatively analyzed using a scoring system. 0 = no; 1 = mild; 2 = moderate; 3 = strong. Each symbol represents one case. *p < .05; **p < .01, Two-way ANOVA (Tukey’s multiple comparisons test).
Figure 5.
(Continued)