
Figure 6.
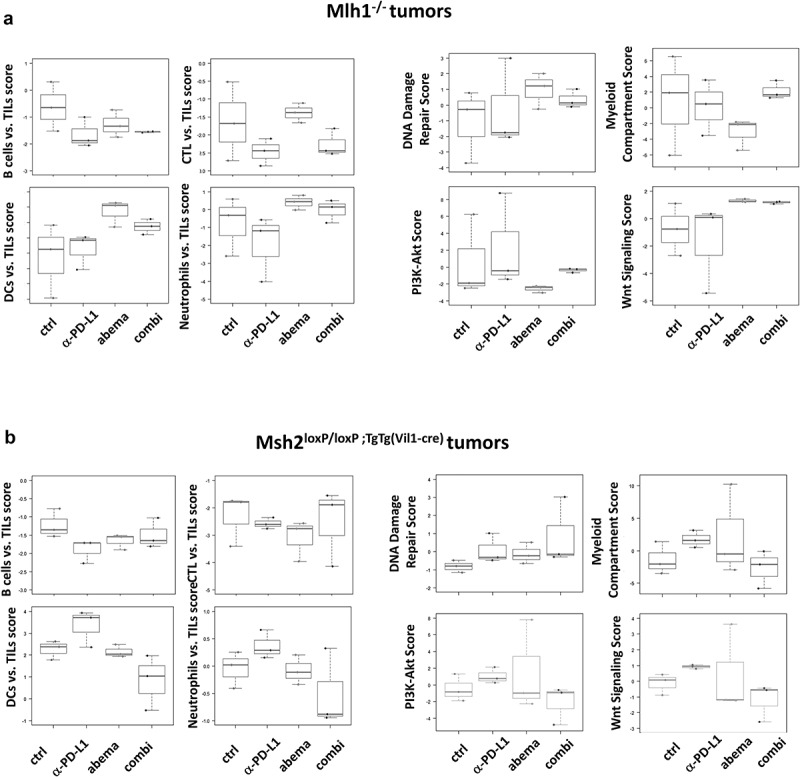
Nanostring gene expression analysis of tumors from Mlh1−/− and Msh2loxP/loxP;TgTg(Vil1−cre) mice. The PanCancer IO 360 Gene Expression Panel was applied. Relative abundances measuring various contrasts between cell types reported for each group. Data result from n = 3 samples/group.