
Figure 7.
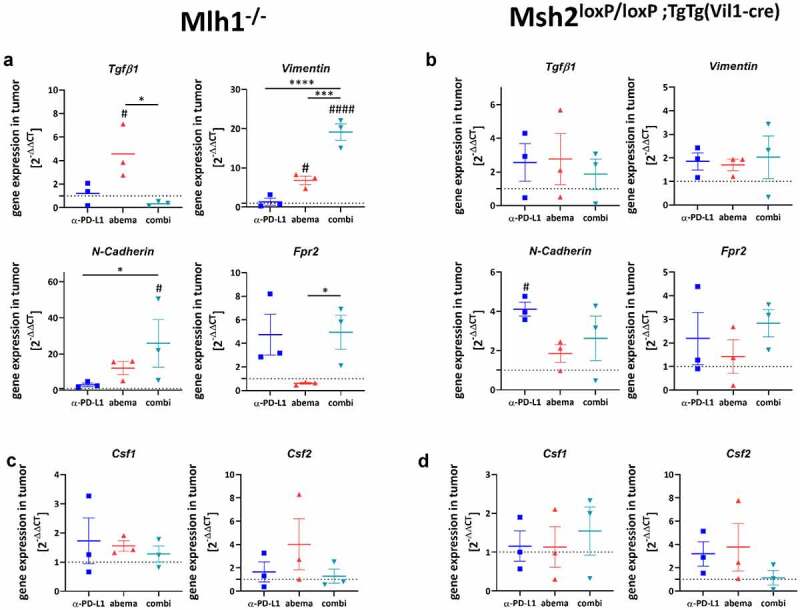
Expression levels of selected genes and functional immunological analysis. (a-f) Total RNA from tumors (A-F) and spleens (g, h) was reverse transcribed into cDNA and qPCR was done as described in material and methods. All data are given as 2-ΔΔCT values + SEM. Analysis was done in triplicates with n = 3 mice/group, respectively, * p < .05; *** p < .001; **** p < .0001; # p < .05; ## p < .01; #### p < .0001 vs. control. One-way ANOVA (Tukey’s multiple comparisons test) or Kruskal-Wallis test (Dunn’s multiple comparisons test).
Figure 7.
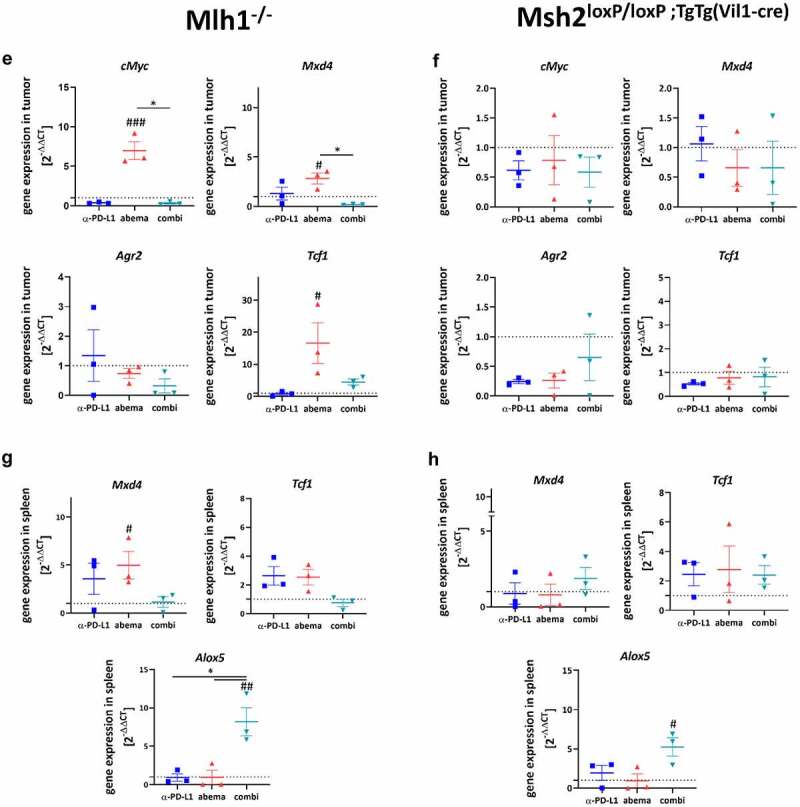
(Continued)