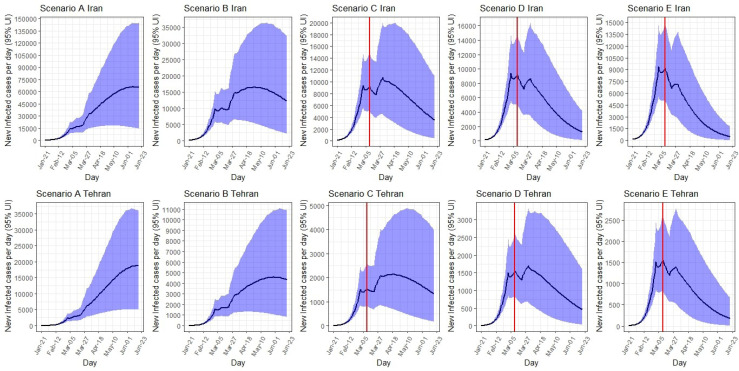
Figure 4.
The Estimated Number of New Infected Cases Per Day in Iran and Tehran Under 5 Different Isolation Scenarios From January 21, 2020 to June 19, 2020. The red line refers to the time when interventions were implemented and the blue area corresponds to UIs. Abbreviation: UI, uncertainty interval.

