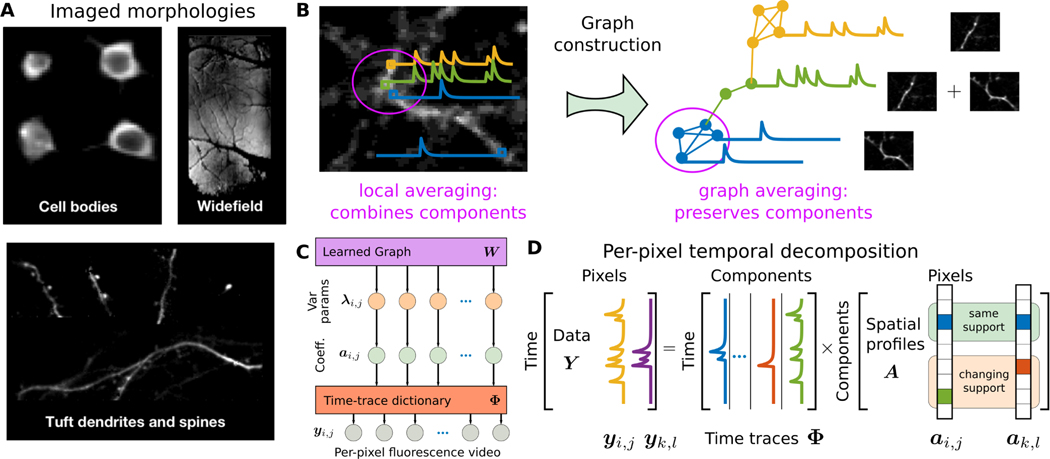
Fig. 1.
Graph-based dictionary learning for calcium image analysis. A: Optical imaging of different neural components at different scales. B: In calcium imaging, distant pixels might be highly correlated while neighboring pixels might be very different. For example, for two crossing dendrites any technique based on local averaging is prone to corruption by competing signals. By reorganizing the pixel relationships into a data-drive graph, local averaging defined by the graph can make more judicious use of temporal correlations between pixels and extract better signal estimates. C: The graphical model of GraFT organizes variables into three layers: a set of variance parameters interconnected by the data-driven graph W, a set of sparse coefficients conditioned on the parameters, and the observed fluorescence video which is linearly generated by the coefficients through the dictionary Φ. D: Matrix factorization model: GraFT emphasizes the role of time-traces and decomposes the data into a dictionary of component time-traces and correspoding spatial maps.

