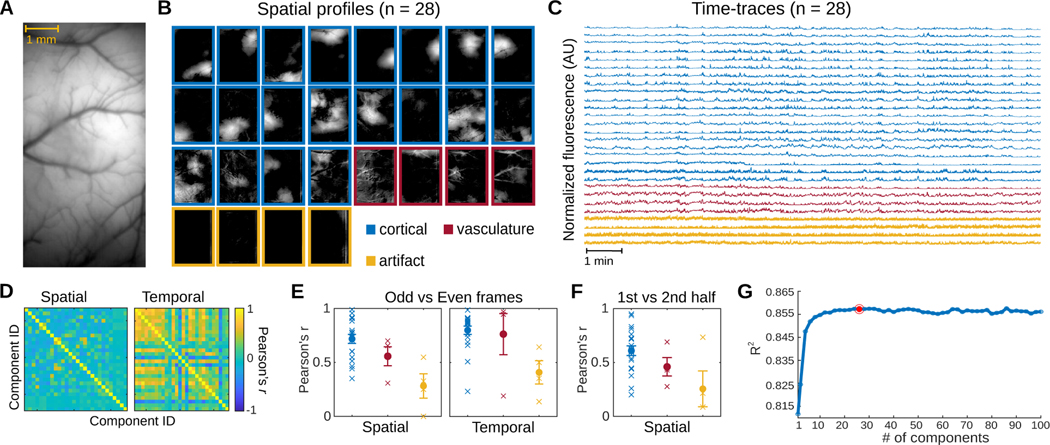
Fig. 7.
Widefield data. A. The imaged cross-cortical field-of-view. B. GraFT spatial maps when run with n = 28 components. Three main classes of components can be identified: broad cortical activity (blue), vasculature-based fluorescence (red), and imaging artifacts (yellow). C. Time-traces for the n = 28 case, color coded by the class of the component. D. GraFT demonstrates inference consistency, as demonstrated by comparing the learned time-traces and spatial maps for GraFT run only on the odd and even frames separately. Pearson’s correlation between best-matched spatial and temporal maps are very high for all maps and dictionary elements for the case of n = 28. E. Breakdown of the diagonal elements of the correlation matrix in D by class (cortical, vascular, and artifactual). The learned spatial maps and time-traces for cortical maps was the most consistent, with the highest correlation values. F. A similar analysis of spatial maps learned separately across the first half and the second half of the imaging session for n = 28 demonstrates that consistent cortical areas are observed during the same behavior even over different epochs. G. Variance explained as a function of the number of dictionary elements shows a plateau at approximately 0.855 with ≈ 20 components.

