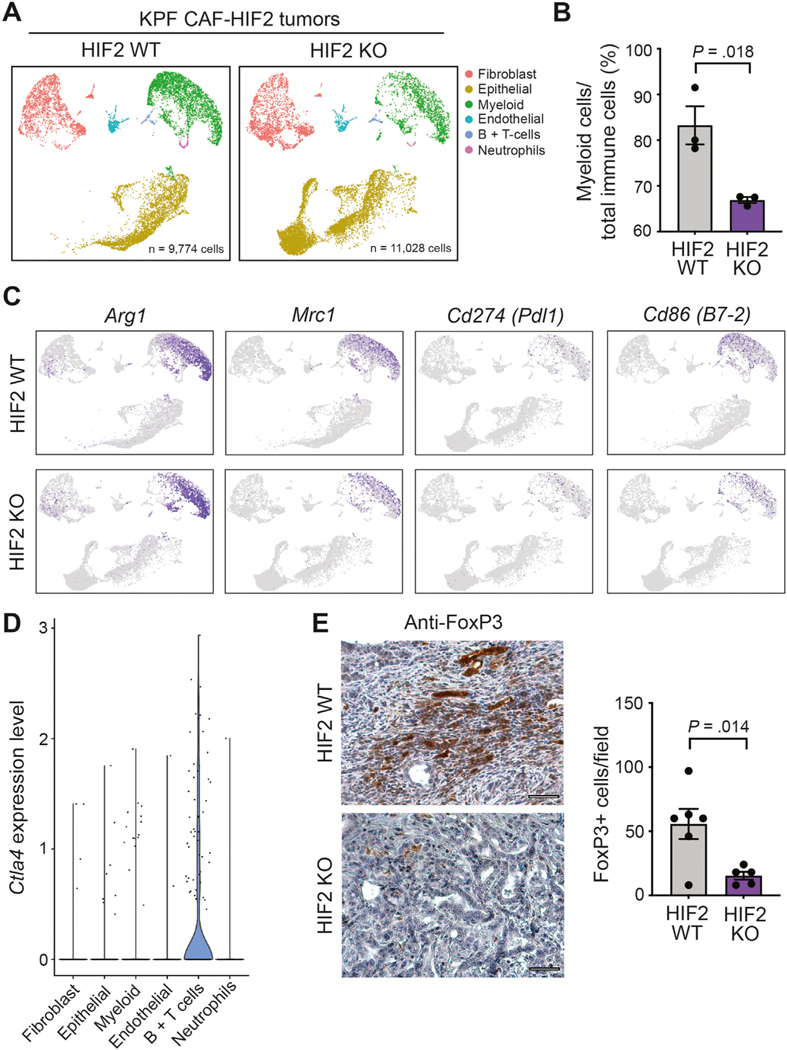
Figure 5.
Deletion of HIF2 in CAFs reduces PDAC immunosuppression. (A) UMAP of scRNA-seq analysis of 20,802 cells isolated from KPF CAF-HIF2 WT tumors (9774 cells; n = 3 mice) and KPF CAF-HIF2 KO tumors (11,028 cells; n = 3 mice). Cell types were identified through graph-based clustering followed by manual annotation using known marker genes. (B) Average percentage of myeloid cells over immune cells sequenced per tumor. (C) M2-polarized TAMs were identified within the myeloid cell population via expression of Arg1 and Mrc1. Immunosuppressive TAMs were identified within the myeloid cell population via expression of Cd274 (Pdl1) and Cd86 (B7–2). (D) Violin plots showing findings on scRNA-seq analysis of Ctla4 in KPF CAF-HIF2 WT and KO tumors in all identified cell types. (E) Left: Representative IHC images of CAF-HIF2 WT and KO tumors stained for FoxP3 and counterstained with hematoxylin QS (n = 5–6/group); scale bars, 50 μm. Right: Quantification of FoxP3+ Tregs per field. All error bars represent mean ± SEM; P, by Student t test, unless otherwise noted. See also Supplementary Figure 10.

