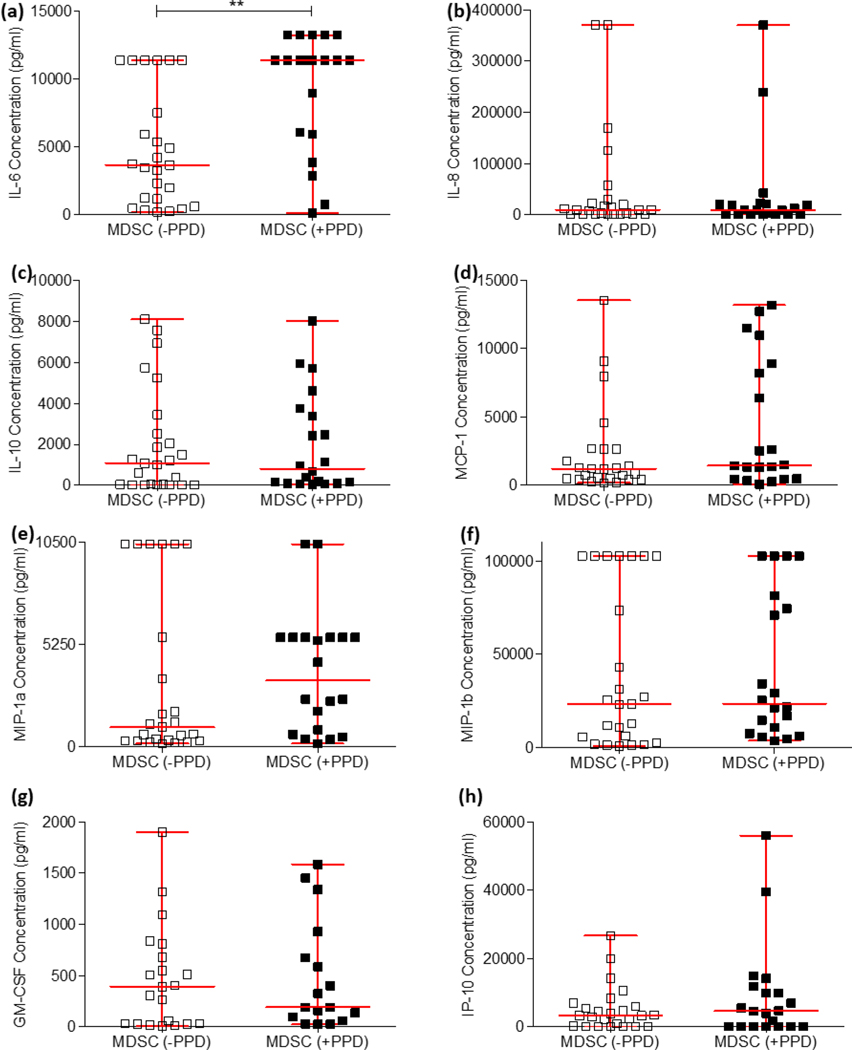
Figure 2:
The production of twelve extracellular cytokines were assessed using the Luminex immunoassay platform to compare differences in production between PPD-stimulated (n = 20) and unstimulated MDSC (n = 25). D’Agostino & Pearson Omnibus test for normality was used to determine the distribution of the datasets, after which the statistics used for the cytokines IL-6 and MIP-1a were parametric (unpaired t-test), and the statistics used for the remaining cytokines were non-parametric (MannWhitney test). Error bars represent the median and range. ***P < 0.001; **P < 0.01; *P < 0.05; ns: not significant.

