Fig. 4.

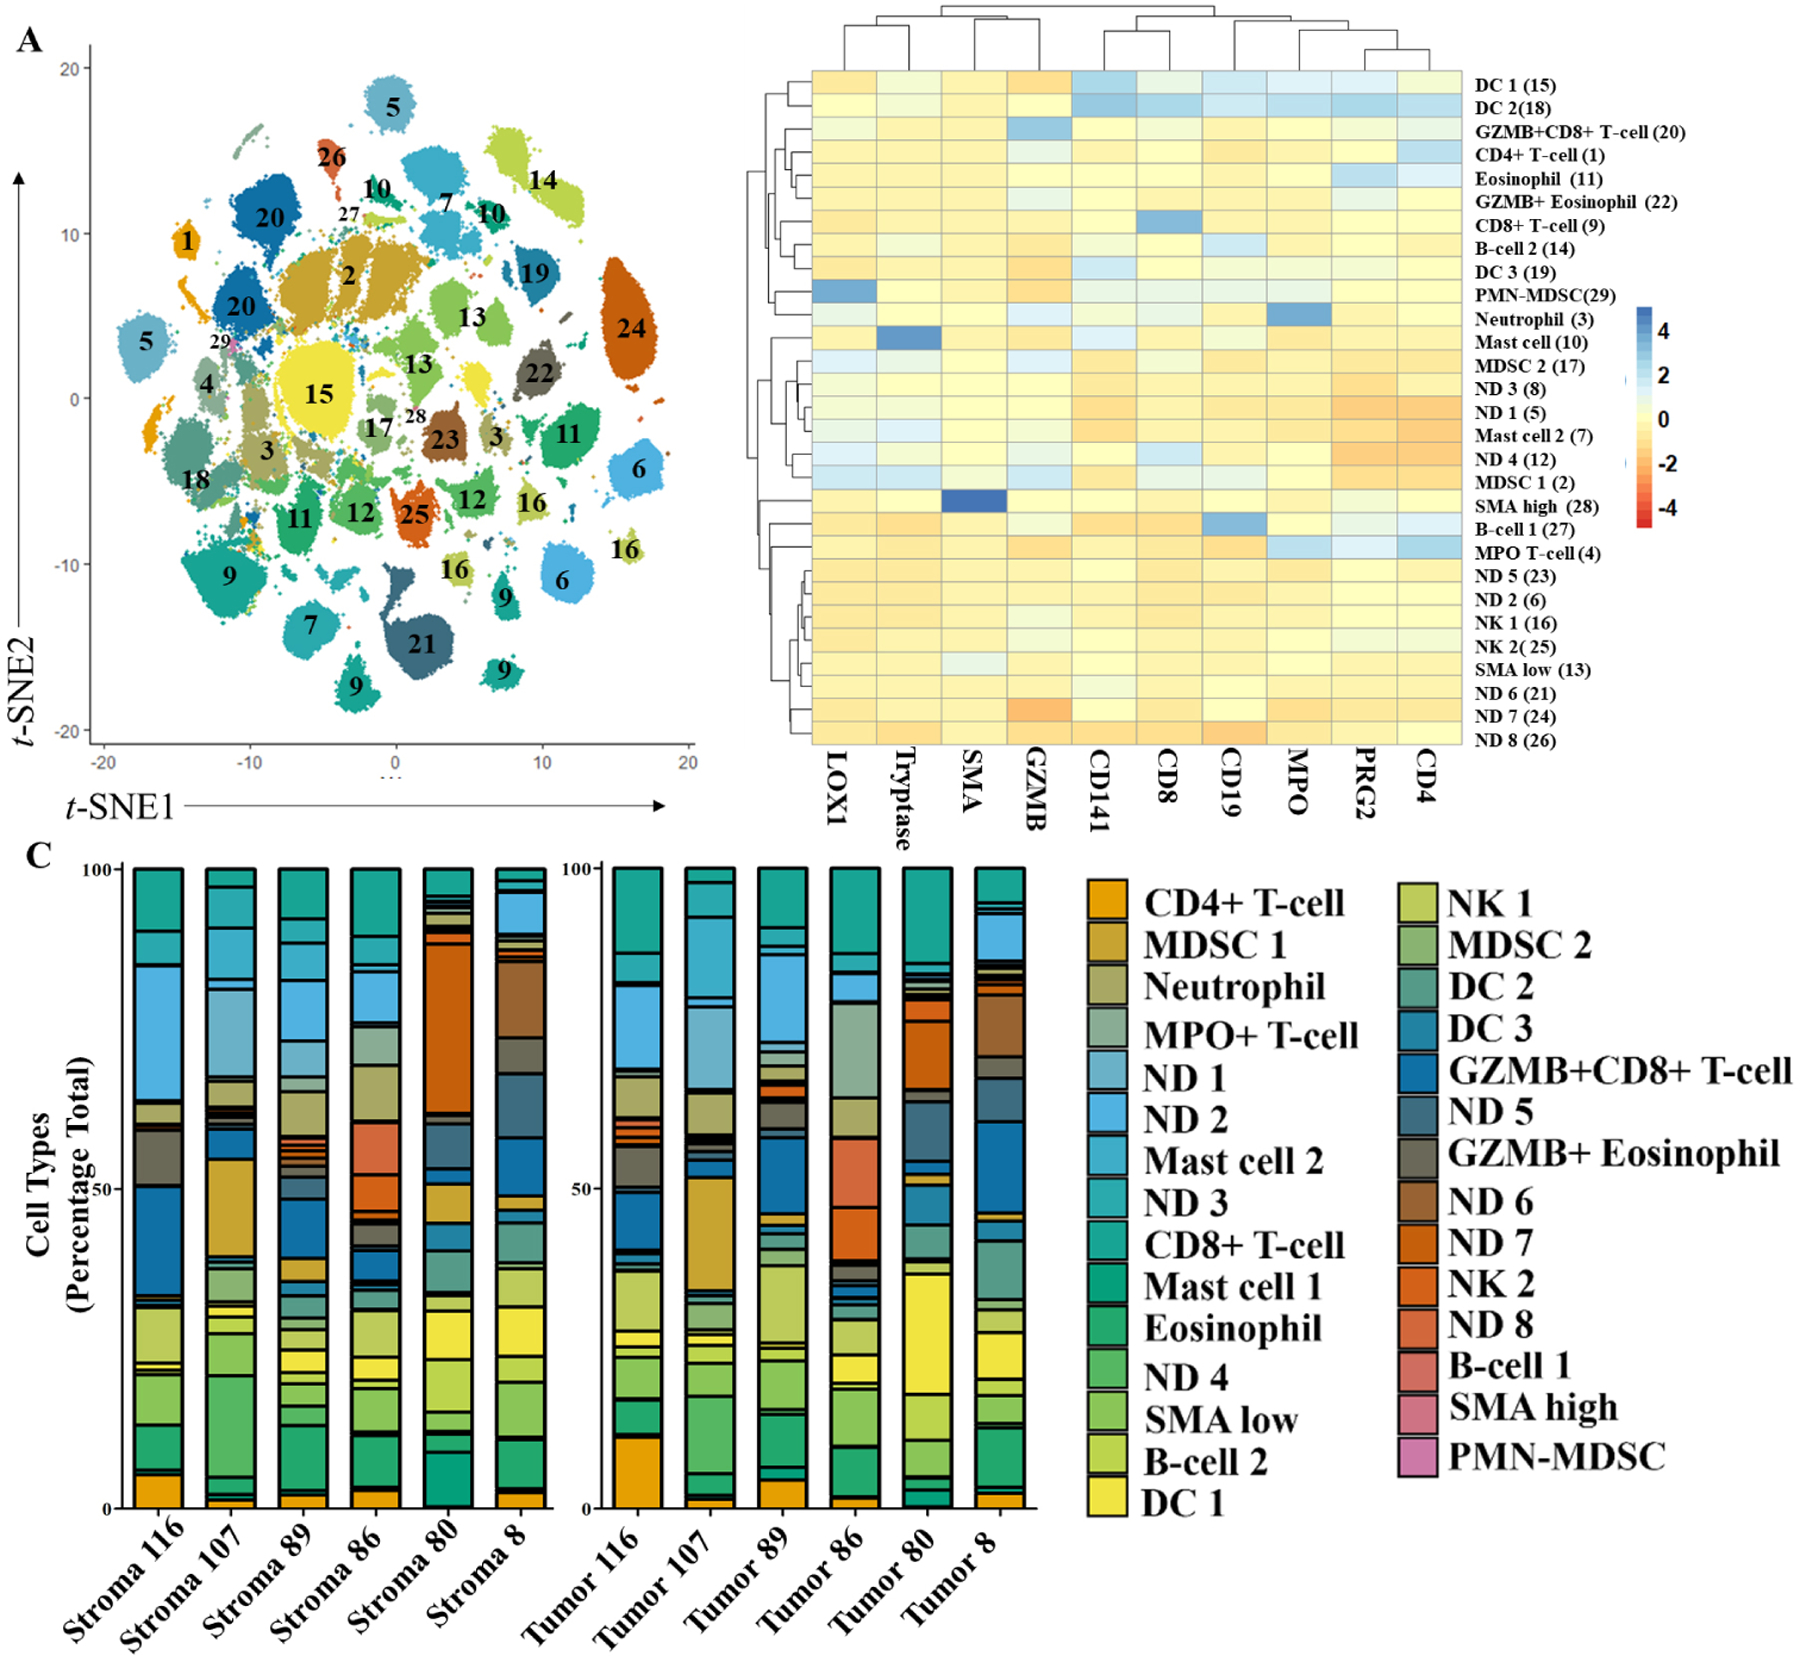
Distribution of tumor-associated immune cells identified in PDAC TMEs using top ten tumor-predicting markers and unsupervised clustering. A) t-SNE plot of clustered cell groups (numbered) using RFA-identified antigens. B) Heatmap of the average cellular antigen intensity in groupings (see 4A) identified via Louvain clustering. Initial groupings shown in parentheses. C) Stacked bar plot of cell types identified with Louvain clustering of tumor and stroma tissues. Cell group colors matched in A and C.
