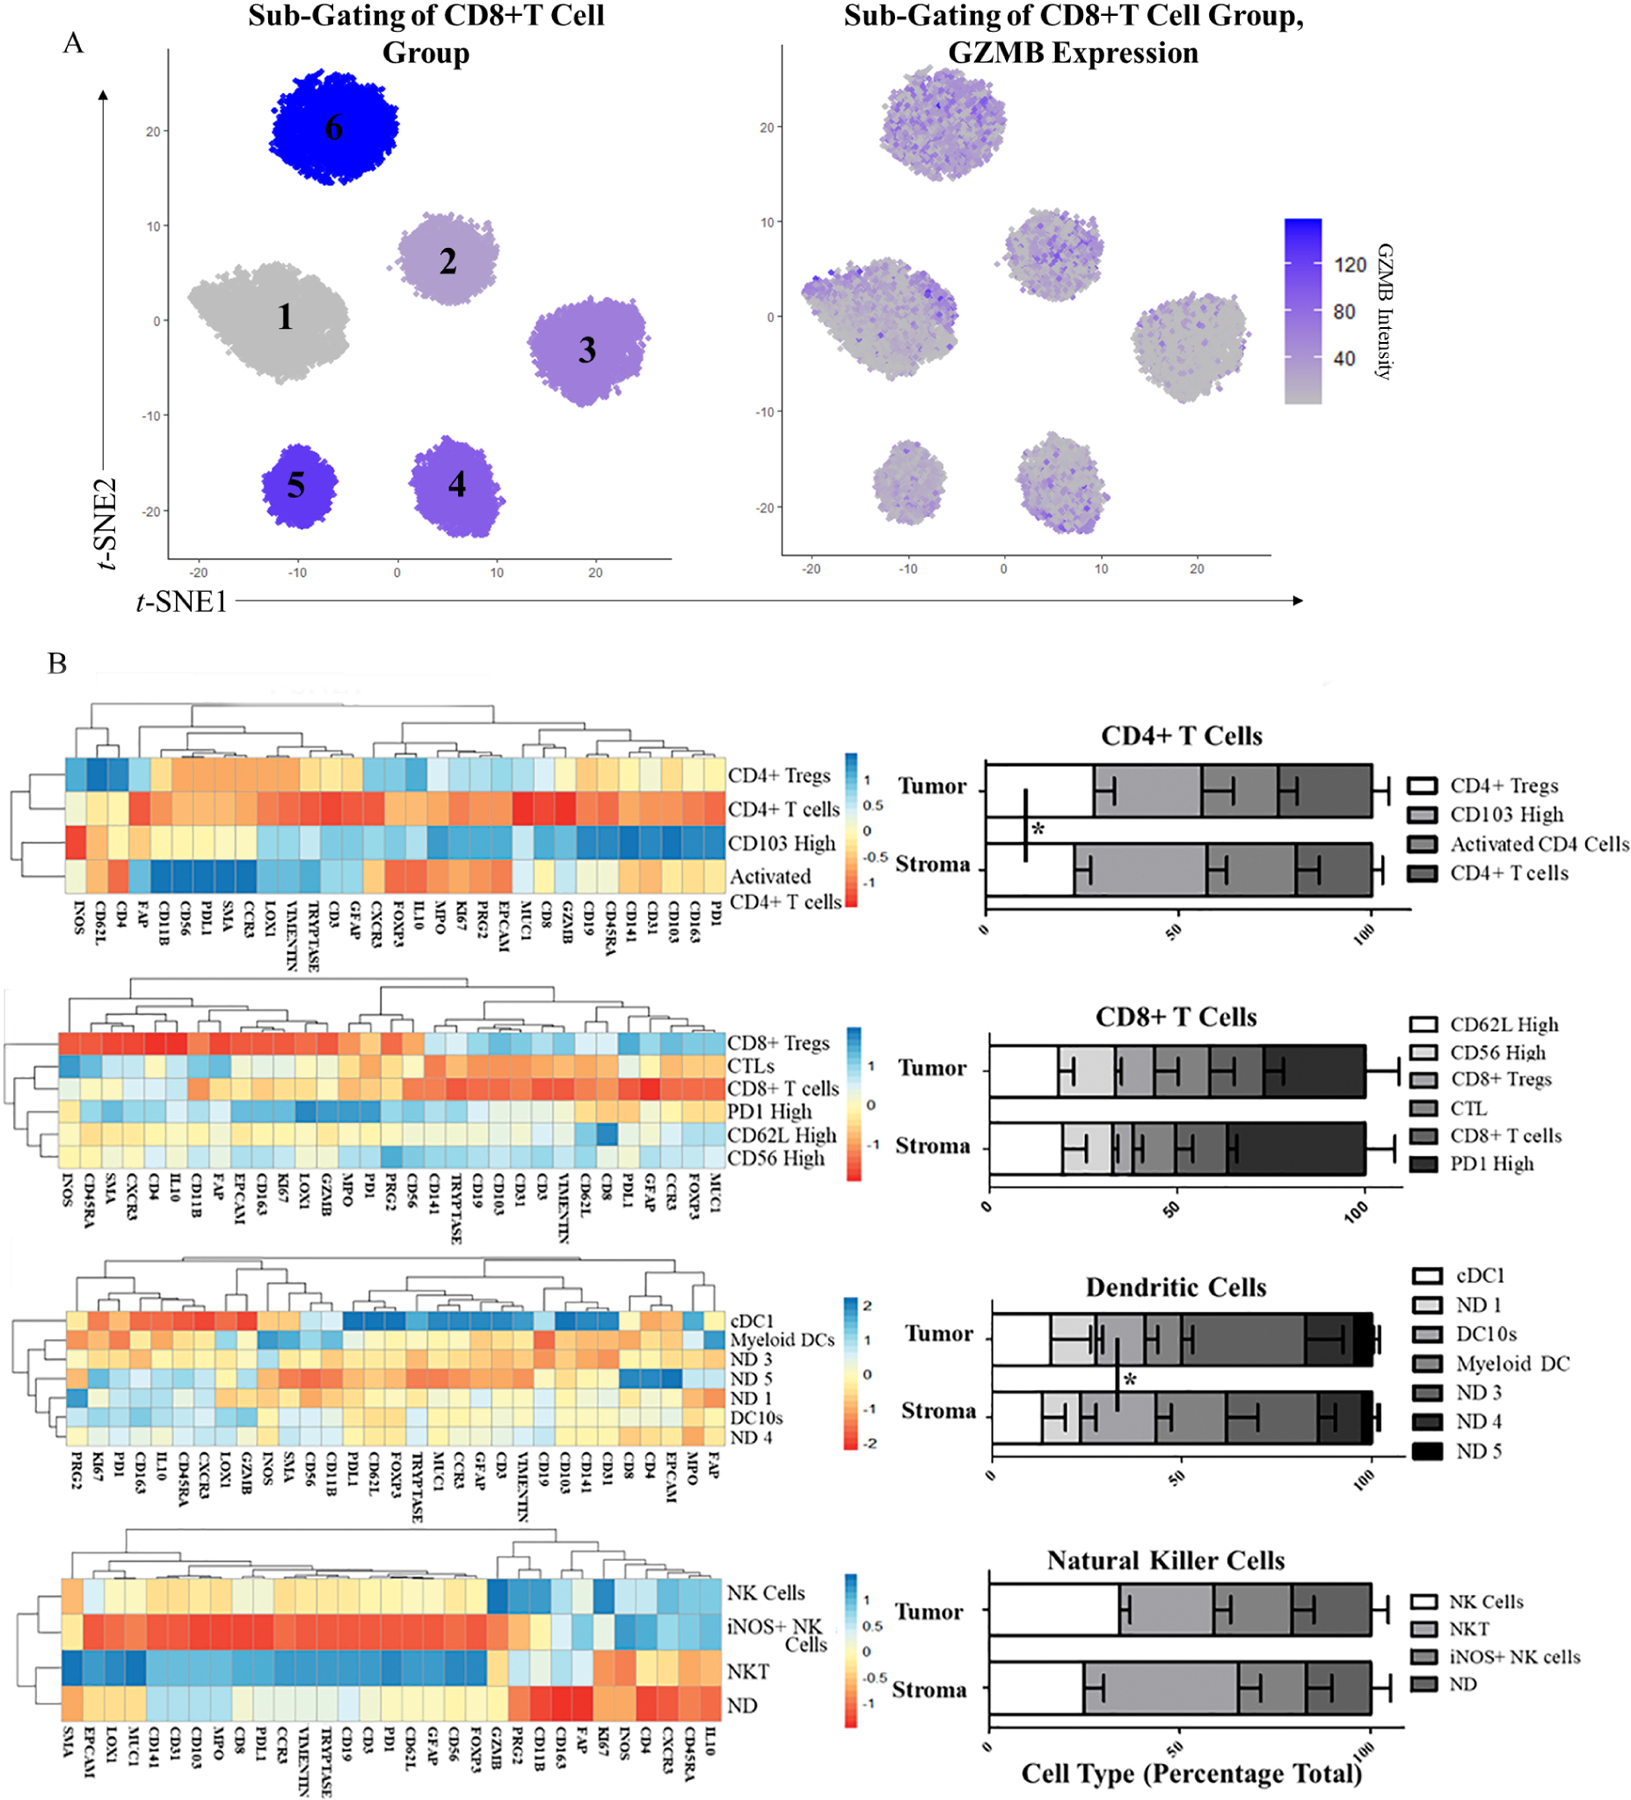
Fig. 6.

Sub-Gating of CD4+ and CD8+ T Cells, DCs, and NK cells. A) CD8+ T cell sub-gating using Louvain clustering (t-SNE plot) and GZMB distribution in CD8+ T cells (feature plot). B) Heatmaps of average marker expression in CD4+ T cells, CD8+ T cells, DC 2, and NK 2 cells. C) Stacked bar plot of CD4+ T cell, CD8+ T cell, DC 2, and NK 2 cell sub-gated cell groups in tumor and stroma regions in all patients. * = p < 0.05.
