FIGURE 1.
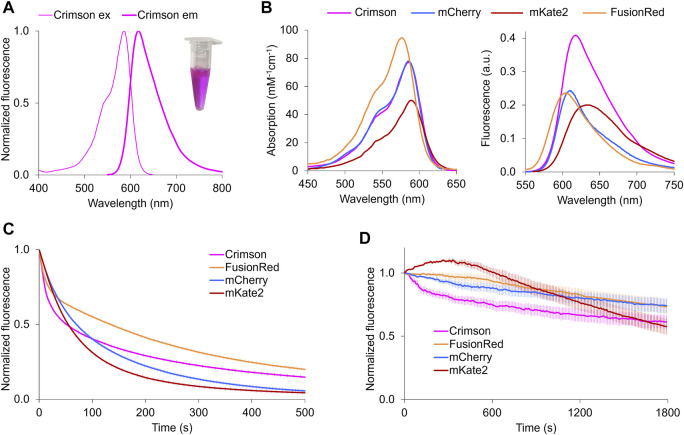
Characterization of Crimson in vitro and neurons. (A) Fluorescence spectra of Crimson. Inset, purified Crimson in visible light. (B) Absorption (left) and emission (right) of RFPs with excitation maxima at 580–590 nm. Absorbance spectra are scaled to peak extinction coefficient. Emission spectra are scaled so that areas under the curves are proportional to peak brightness (product of peak extinction coefficient and quantum yield). (C) Photobleaching kinetics of purified RFPs under arc lamp illumination with a 568/20-nm excitation filter. Time is scaled so that emission is normalized to 1000 photons per s. Imaging interval = 1 s. Each curve is the mean of two independent experiments with the error bars denoting SD (standard deviation, n ≥ 6). (D) Photobleaching of RFPs in transfected neurons under 585-nm laser illumination. Fluorescent intensity of each time frame is subtracted against the background and normalized to time point 0. Imaging interval = 10 s. Each curve is the mean with the error bars denoting SD (n = 3).

