Figure 22.
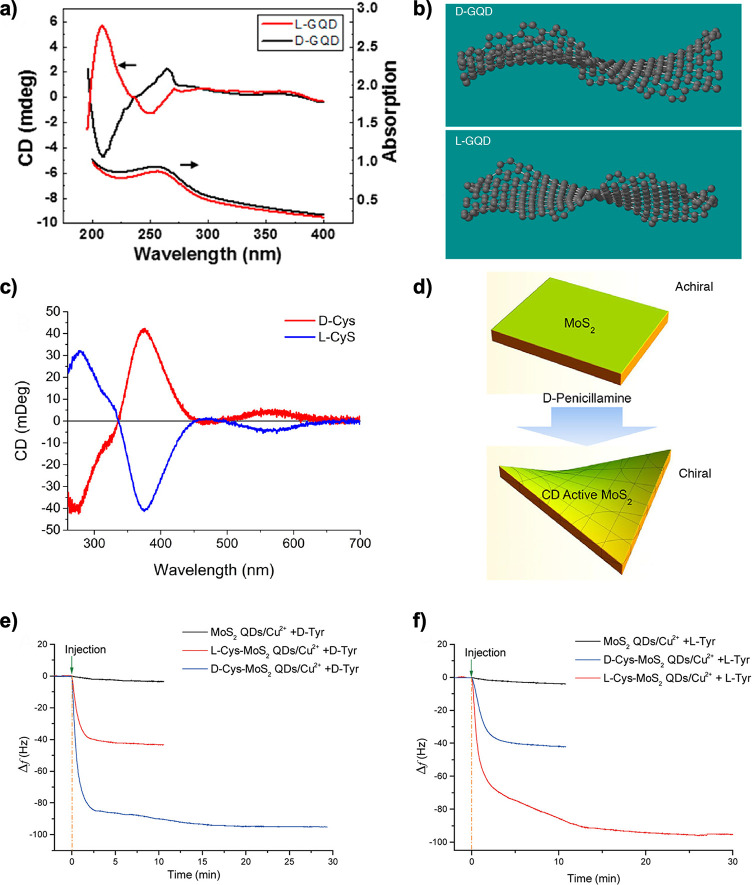
(a) Circular dichroism (CD) and optical absorption spectra for l-graphene quantum dot (l-GQD, red) and d-GQD (black) dispersions. (b) Schematic of the structures of d-GQD and l-GQD on a 3 nm QD. The rotation direction of the helices is opposite to the handedness of the edge ligands. (c) CD spectra of d-/l-cysteine functionalized MoS2 after exfoliation. Similar results for d-/l-penicillamine were obtained (not shown here). (d) Diagram of the deformations generated by molecular functionalization of d-penicillamine inducing chirality on MoS2 layers. (e,f) Frequency shifts of the d- and l-Cys-MoS2 QDs/Cu2+ sensors exposed to (e) 5 mM d-Tyr and (f) 5 mM l-Tyr solution. Panels (a,b) adapted with permission from ref (227). Copyright 2016 American Chemical Society. Panels (c,d) adapted with permission from ref (235). Copyright 2018 American Chemical Society. Panels (e,f) adapted with permission from ref (248). Copyright 2018 American Chemical Society.

