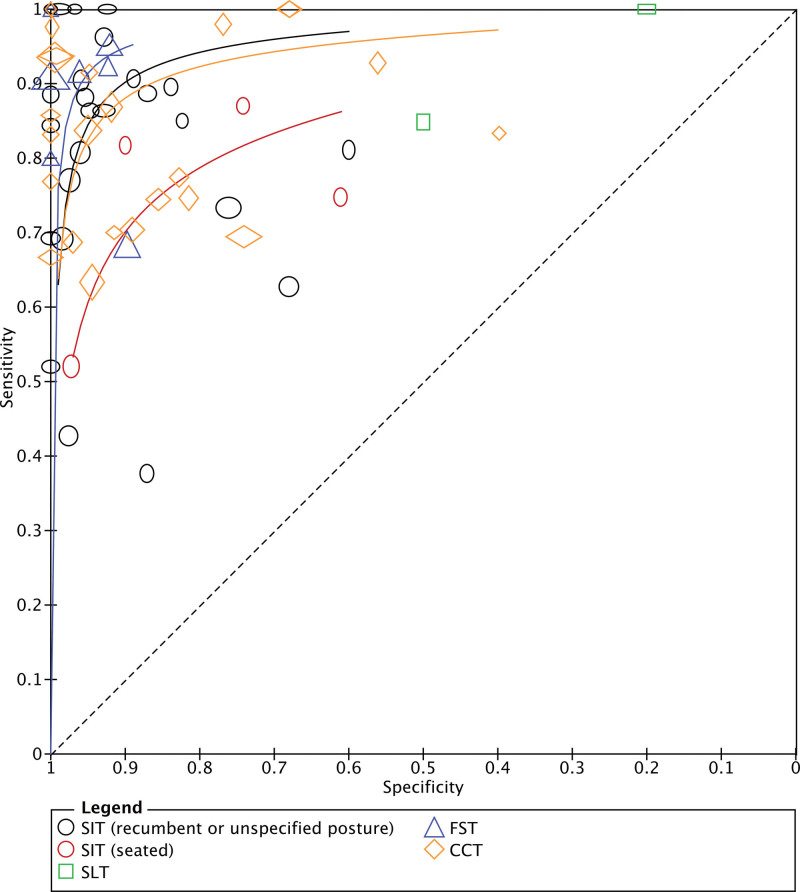
Figure 2.
Summary receiver operating characteristics curves. The clear markers correspond to individual studies. The size of each marker reflects study size (with height proportional to the number diseased and the width with the number nondiseased). A summary curve could not be provided for the oral salt loading test because there were only 2 studies. CCT indicates captopril challenge test; FST, fludrocortisone suppression test; SIT, intravenous saline infusion test; and SLT, oral salt loading test.

