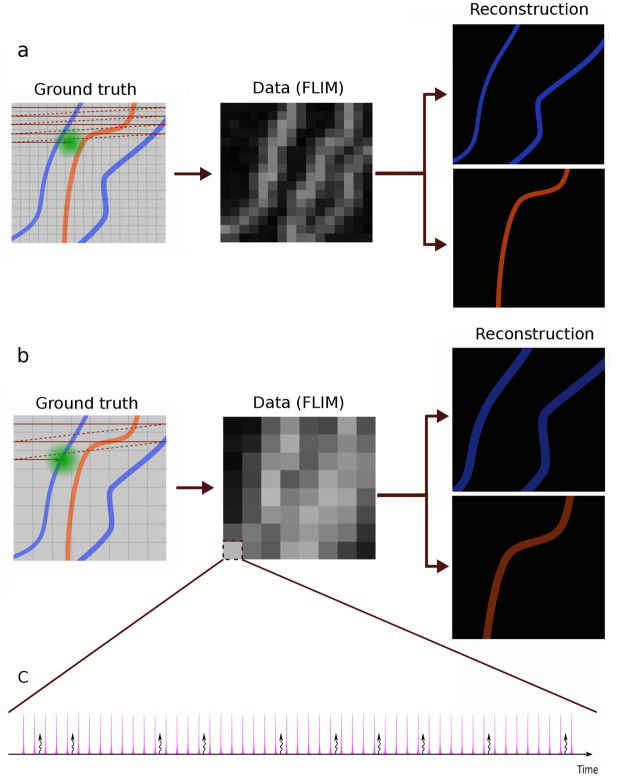
Figure 1.
A cartoon representation illustrating how a specimen is scanned and the image is deconvolved. Here, we envision a sample stained with two different fluorophores, and the data are collected using a scanning confocal microscope, where the grid represents pixels. (a) The sample is scanned with fine separation between the scanning trajectories. This separation determines the pixel size. We use BNPs to determine the lifetimes of individual species and reconstruct their underlying lifetime map (which may designate the location of cellular structures depending on the stain’s affinity). (b) The sample is scanned using a larger distance between the scanning trajectories (larger pixel size). As an important control of our method, we can ask to what degree BNPs may reconstruct the lifetime maps from such data that would have been obtained from the analysis of the smaller pixel (higher resolution) data. (c) Each pixel is scanned by a train of equally temporally spaced excitation pulses. The pink spikes show laser pulses, and the curly arrows represent detected photons. In the most general case, the pink spikes have a finite width, and it cannot be assumed that photons are generated from an excitation caused by the pulse immediately preceding it.

