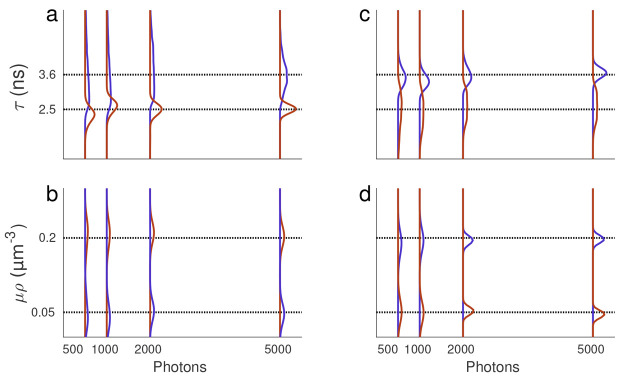
Figure 2.
Lifetime posteriors under uniform μρ profiles. (a, b) The resulting posterior over lifetime and μρ obtained from the data simulated with spatially uniform profiles, as anticipated for any well-stirred solution (in vitro) experiments. (c, d) The resulting lifetime and μρ posteriors from in vitro experiments using a mixture of two fluorophore species (Fluorescein and Coumarin6). The dashed black lines represent ground truths (known for synthetic data and determined using phasor analysis for in vitro data). The blue and brown curves, respectively, correspond to the larger and smaller lifetimes of Fluorescein and Coumarin6, respectively.

