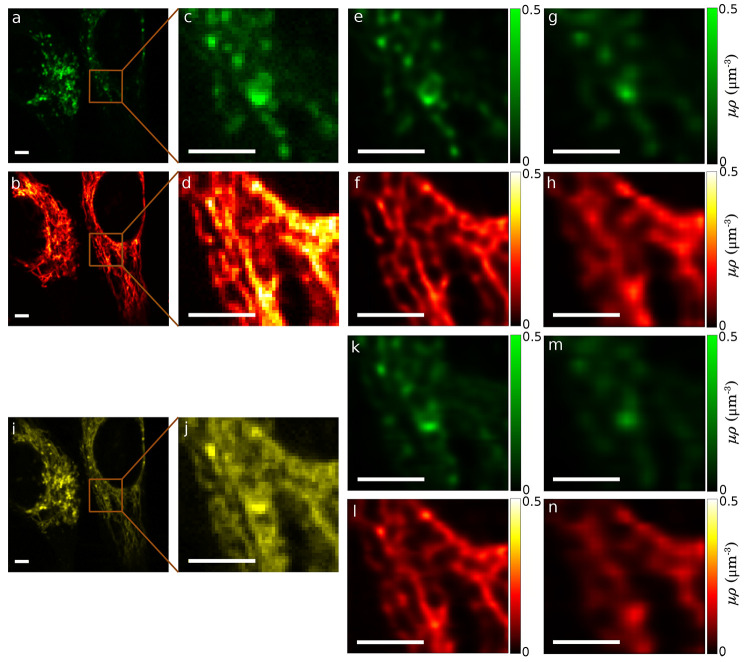
Figure 4.
In vivo FLIM data sets acquired from lysosomes and mitochondria labeled with two fluorophore species within HeLa cells. (a, b) Experimental FLIM data images of spectrally resolved lysosomes (green) and mitochondria (red) acquired simultaneously within the same cell. (c, d) Zoomed-in regions inside the boxes in (a) and (b). (e, f) Learned μρ profiles of lysosomes and mitochondria using all the photons in (c) and (d), respectively. (g, h) Learned μρ profiles obtained by ignoring photons from pixels with even rows and columns in (c) and (d), respectively. (i) Shown in yellow is the raw FLIM image of a combination of lysosomes and mitochondria in (a) and (b). (j) Zoomed-in region inside the box in (i). (k, l) Learned μρ profiles of lysosomes and mitochondria, respectively, with a subpixel resolution (1/3 of the pixel size), using all photons in (j). (m, n) Learned μρ profiles of lysosomes and mitochondria, respectively, ignoring photons from pixels with even column and row indices in (j). Scale bars are 4 μm.

