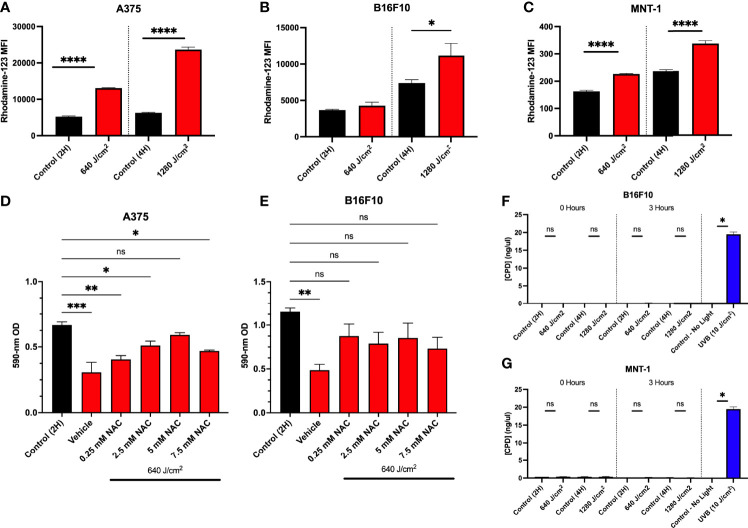
Figure 4.
Increases in ROS due to RL decrease cell proliferation. (A) A375 (n=3), (B) B16F10 (n=5), and (C) MNT-1 (n=4) cells were irradiated with 640 and 1280 J/cm2 RL, and rhodamine-123 MFI was assessed at 0 hours post-treatment using flow cytometry. (D) A375 (n=4) and (E) B16F10 (n=5) cells were pretreated with 0.25 to 7.5 mM NAC and irradiated with 640 J/cm2 RL. Cell count was assessed by measuring cell staining intensity with crystal violet 48 hours after irradiation. (G) B16F10 and (F) MNT-1 cells were irradiated with 640 to 1280 J/cm2 RL or UVB (10 J/cm2). DNA was collected at 0 and 3 hours post-irradiation and analyzed for CPDs using ELISA. RL and control MFI and CPD concentration for 640 and 1280 J/cm2 RL was compared using a two-tailed T-test (p<0.05). ANOVA was used to compare RL and NAC treated groups to control. Cell count was assessed by measuring cell staining intensity with crystal violet 48 hours after NAC. Ordinary one-way ANOVA (p<0.05) compared NAC pretreatments and control. Dunnett’s post-hoc testing compared the mean of every RL group to control. 2H, 2 hour; 4H, 4 hour; UVB, ultraviolet B; NAC, n-acetylcysteine; OD, optical density. *denotes p<0.05, ** denotes p<0.01, *** denotes p<0.001, **** denotes p<0.0001, ns and denotes not significant.

