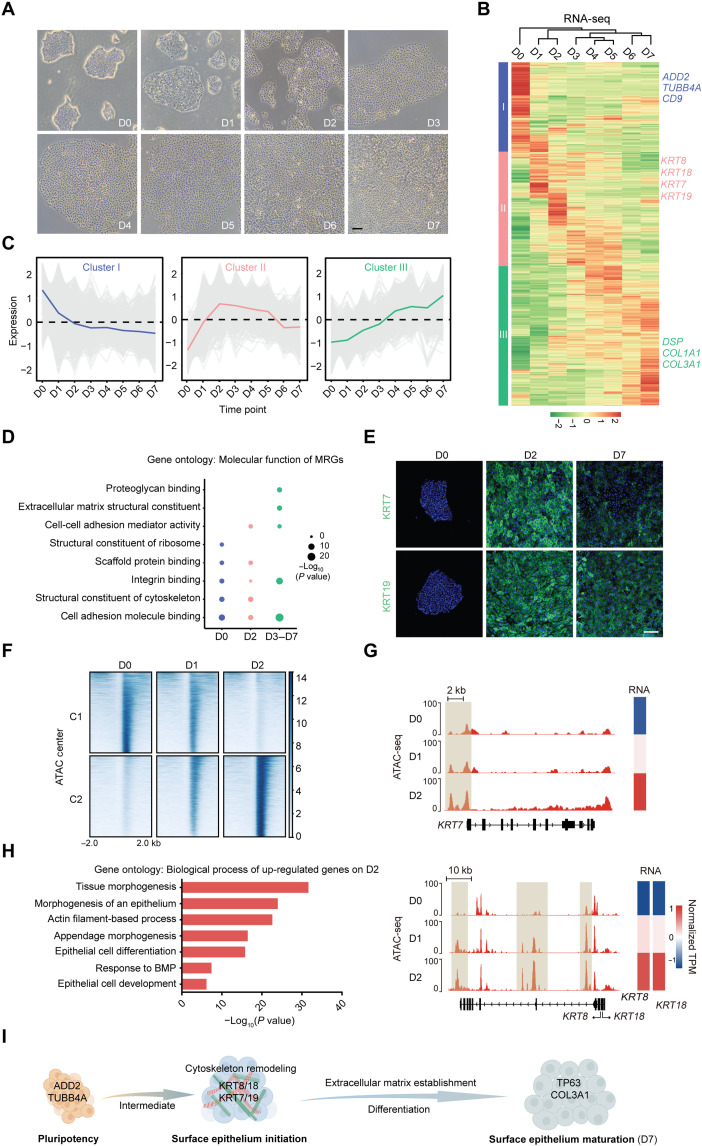
Fig. 1. Dynamic features of MRG identify cell fate transitions during SE lineage commitment.
(A) Phase contrast images of the differentiating hESCs during 7 days of culture. Scale bar, 100 μm. (B) Heatmap of MRG expression changes during SE differentiation. Hierarchical clustering yields three clusters of genes and four major groups of samples. The color bar shows the relative expression value [z score of TPM (transcripts per kilobase of exon model per million mapped reads)] from the RNA sequencing (RNA-seq). (C) The trend of expression changes of the three clusters identified from RNA-seq. (D) Gene ontology (molecular function) analysis of MRGs at each time point. (E) Immunofluorescence staining of KRT7 and KRT19 in the differentiated cells on D0, D2, and D7. Scale bar, 100 μm. (F) K-means clustering analysis of differential open chromatin regions during the first 2 days of SE differentiation. The color bar shows the relative assay for transposase accessible chromatin with high-throughput sequencing(ATAC-seq) signal (z score of normalized read counts) as indicated. (G) Snapshots of genome browser showing chromatin accessibility at KRT7, KRT8, and KRT18 loci. Gene expression is also displayed in heatmaps (log2 TPM). The genome browser view scales were adjusted on the basis of the global data range. (H) Representative gene ontology terms (biological process) identified from the differentially expressed genes in D2 differentiated cells. (I) Schematic diagram of SE differentiation.

