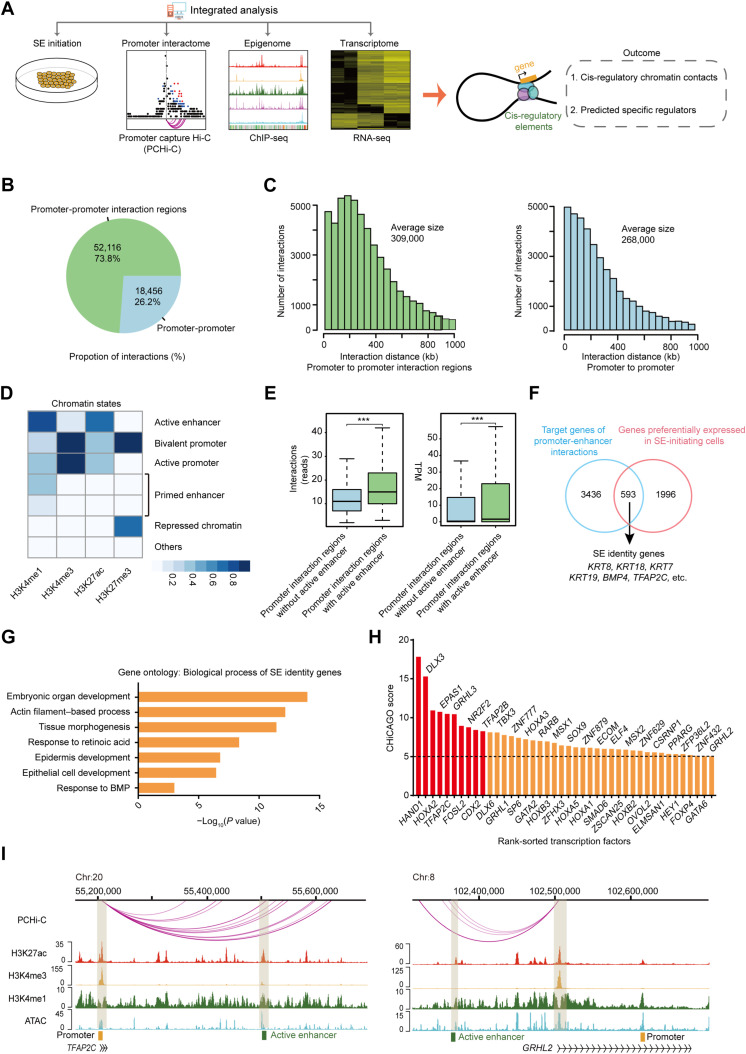
Fig. 2. Multiomics analysis delineates the cis-regulatory network of SE initiation.
(A) Scheme of the research route and method in this study. (B) Pie chart of the number and percentage of promoter-promoter interactions and promoter-promoter interaction regions interactions of SE-initiating cells. (C) Histograms of the distribution of the distance between promoter and promoter interaction regions and between promoter and promoter of SE-initiating cells. (D) Heatmap of different ChromHMM state enrichment of SE-initiating cells. The blue shading depicts the average intensity of a particular epigenetic mark across each chromatin state. The color scale shows the relative enrichment. (E) Left: Box plot of the number of interactions in promoter interaction regions with or without active enhancer. Right: Box plot of the target gene expression level of promoter interaction regions with or without active enhancer ***P < 0.001 from two-way ANOVA. (F) Venn diagram showing overlap between SE identity genes and genes highly expressed in SE-initiating cells. (G) Representative gene ontology terms (biological process) identified from SE identity genes. (H) Histogram of CHiCAGO scores of the candidate transcription factors. (I) Genome browser view of H3K27ac, H3K4me3, H3K4me1, ATAC-seq signals, and promoter-enhancer interactions at TFAP2C and GRHL2 loci in SE-initiating cells. Chromatin states are indicated (active enhancer, green; active promoter, yellow).

